PKF Hotel Market Demand and Financial Analysis - DIA Business ...
PKF Hotel Market Demand and Financial Analysis - DIA Business ...
PKF Hotel Market Demand and Financial Analysis - DIA Business ...

Create successful ePaper yourself
Turn your PDF publications into a flip-book with our unique Google optimized e-Paper software.
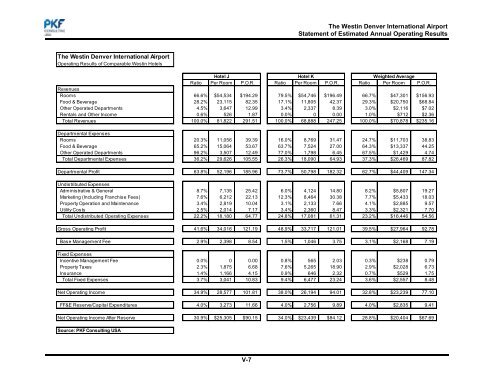
The Westin Denver International AirportStatement of Estimated Annual Operating ResultsThe Westin Denver International AirportOperating Results of Comparable Westin <strong>Hotel</strong>s<strong>Hotel</strong> J <strong>Hotel</strong> K Weighted AverageRatio Per Room P.O.R. Ratio Per Room P.O.R. Ratio Per Room P.O.R.RevenuesRooms 66.6% $54,534 $194.29 79.5% $54,746 $196.49 66.7% $47,301 $156.93Food & Beverage 28.2% 23,115 82.35 17.1% 11,805 42.37 29.3% $20,750 $68.84Other Operated Departments 4.5% 3,647 12.99 3.4% 2,337 8.39 3.0% $2,116 $7.02Rentals <strong>and</strong> Other Income 0.6% 526 1.87 0.0% 0 0.00 1.0% $712 $2.36Total Revenues 100.0% 81,822 291.51 100.0% 68,888 247.25 100.0% $70,878 $235.16Departmental ExpensesRooms 20.3% 11,056 39.39 16.0% 8,769 31.47 24.7% $11,703 38.83Food & Beverage 65.2% 15,064 53.67 63.7% 7,524 27.00 64.3% $13,337 44.25Other Operated Departments 96.2% 3,507 12.49 77.0% 1,798 6.45 67.5% $1,429 4.74Total Departmental Expenses 36.2% 29,626 105.55 26.3% 18,090 64.93 37.3% $26,469 87.82Departmental Profit 63.8% 52,196 185.96 73.7% 50,798 182.32 62.7% $44,409 147.34Undistributed ExpensesAdministrative & General 8.7% 7,135 25.42 6.0% 4,124 14.80 8.2% $5,807 19.27<strong>Market</strong>ing (Including Franchise Fees) 7.6% 6,212 22.13 12.3% 8,464 30.38 7.7% $5,433 18.03Property Operation <strong>and</strong> Maintenance 3.4% 2,819 10.04 3.1% 2,133 7.66 4.1% $2,885 9.57Utility Costs 2.5% 2,014 7.17 3.4% 2,360 8.47 3.3% $2,321 7.70Total Undistributed Operating Expenses 22.2% 18,180 64.77 24.8% 17,081 61.31 23.2% $16,446 54.56Gross Operating Profit 41.6% 34,016 121.19 48.9% 33,717 121.01 39.5% $27,964 92.78Base Management Fee 2.9% 2,398 8.54 1.5% 1,046 3.75 3.1% $2,168 7.19Fixed ExpensesIncentive Management Fee 0.0% 0 0.00 0.8% 565 2.03 0.3% $238 0.79Property Taxes 2.3% 1,875 6.68 7.6% 5,265 18.90 2.9% $2,028 6.73Insurance 1.4% 1,166 4.15 0.9% 646 2.32 0.7% $529 1.75Total Fixed Expenses 3.7% 3,041 10.83 9.4% 6,477 23.24 3.6% $2,557 8.48Net Operating Income 34.9% 28,577 101.81 38.0% 26,194 94.01 32.8% $23,239 77.10FF&E Reserve/Capital Expenditures 4.0% 3,273 11.66 4.0% 2,756 9.89 4.0% $2,835 9.41Net Operating Income After Reserve 30.9% $25,305 $90.15 34.0% $23,439 $84.12 28.8% $20,404 $67.69Source: <strong>PKF</strong> Consulting USAV-7