The Westin Denver International AirportStatement of Estimated Annual Operating ResultsFood & Beverage RevenueTotal Amount Per Occupied RoomIn-Terminal <strong>Hotel</strong>s<strong>Hotel</strong> A $8,644,505 $47.14<strong>Hotel</strong> B 7,634,817 60.12<strong>Hotel</strong> C 11,833,408 85.54<strong>Hotel</strong> D 6,212,911 60.57<strong>Hotel</strong> E 7,424,159 47.94<strong>Hotel</strong> F $19,224,327 82.18Westin <strong>Hotel</strong>s<strong>Hotel</strong> G $9,028,241 78.62<strong>Hotel</strong> H 8,551,741 72.47<strong>Hotel</strong> I 12,508,359 100.17<strong>Hotel</strong> J 7,789,645 82.35<strong>Hotel</strong> K 4,792,990 42.37Weighted Average N/A 68.84Subject Stabilized Year $11,915,000 $85.00The comparable hotels indicated a range in food <strong>and</strong> beverage revenue of between$42.37 <strong>and</strong> $100.17 POR. For a stabilized year of operation, we estimate food <strong>and</strong>beverage revenue at the proposed Subject to be approximately $85.00 POR, or atotal of $11,915,000, stated in 2012 value dollars. Our estimate falls within therange indicated by the comparable hotels. Furthermore, based on 29,000 squarefeet of meeting space, our estimate indicates that approximately $410 of food <strong>and</strong>beverage revenue will be generated per square foot of meeting space. This is inline with the food <strong>and</strong> beverage revenue generated on a price per square foot basisof the comparable hotels <strong>and</strong> reflects the fact that the Subject, with approximately30 percent of its dem<strong>and</strong> from the group segment, is projected to be a popularvenue for group meetings <strong>and</strong> banquet functions given its strategic location.Food <strong>and</strong> beverage expense includes product costs, payroll <strong>and</strong> relatedexpenses, <strong>and</strong> other items such as laundry <strong>and</strong> linen, china, glassware <strong>and</strong>silverware, uniform costs, supplies, <strong>and</strong> other miscellaneous items. Presented inthe following table are the historical food <strong>and</strong> beverage expenses of the comparablehotels.V-10
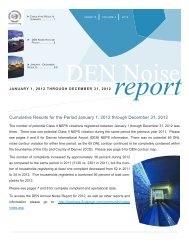
The Westin Denver International AirportStatement of Estimated Annual Operating ResultsFood & Beverage ExpenseRatio to F&B Rev.In-Terminal <strong>Hotel</strong>s<strong>Hotel</strong> A 72.4%<strong>Hotel</strong> B 70.7%<strong>Hotel</strong> C 77.5%<strong>Hotel</strong> D 63.7%<strong>Hotel</strong> E 59.9%<strong>Hotel</strong> F 48.7%Westin <strong>Hotel</strong>s<strong>Hotel</strong> G 63.9%<strong>Hotel</strong> H 66.7%<strong>Hotel</strong> I 67.2%<strong>Hotel</strong> J 65.2%<strong>Hotel</strong> K 63.7%Weighted Average 64.3%Subject Stabilized Year 65.0%Food <strong>and</strong> beverage expense at the Subject is estimated to be approximately 65.0percent of departmental revenue. As noted, our estimate is in line with the food <strong>and</strong>beverage expense ratio of the weighted average of the comparable hotels <strong>and</strong> isdeemed reasonable based on the high percentage of banquet food, beverage <strong>and</strong>meeting space rental revenues.c. Other Operated Departments Revenue <strong>and</strong> ExpenseOther operated departments revenue primarily includes revenue fromtelecommunications services (phone <strong>and</strong> Internet), business services, guest laundryservices, in-room movies, <strong>and</strong> other miscellaneous items. Presented in thefollowing table are the historical other operated departments revenue for thecomparable hotels.V-11