PKF Hotel Market Demand and Financial Analysis - DIA Business ...
PKF Hotel Market Demand and Financial Analysis - DIA Business ...
PKF Hotel Market Demand and Financial Analysis - DIA Business ...

You also want an ePaper? Increase the reach of your titles
YUMPU automatically turns print PDFs into web optimized ePapers that Google loves.
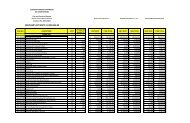
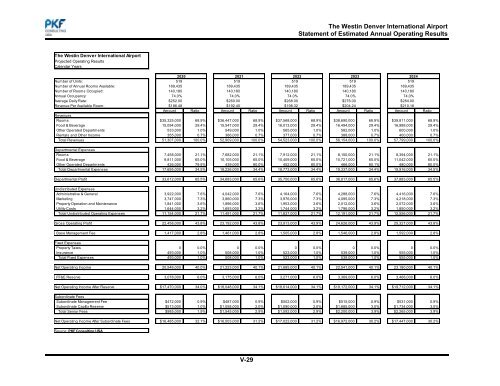
The Westin Denver International AirportStatement of Estimated Annual Operating ResultsThe Westin Denver International AirportProjected Operating ResultsCalendar Years2020 2021 2022 20232024Number of Units: 519 519 519 519 519Number of Annual Rooms Available: 189,435 189,435 189,435 189,435 189,435Number of Rooms Occupied: 140,180 140,180 140,180 140,180 140,180Annual Occupancy: 74.0% 74.0% 74.0% 74.0% 74.0%Average Daily Rate: $252.00 $260.00 $268.00 $276.00 $284.00Revenue Per Available Room: $186.48 $192.40 $198.32 $204.24 $210.16Amount Ratio Amount Ratio Amount Ratio Amount Ratio Amount RatioRevenuesRooms $35,325,000 68.9% $36,447,000 68.9% $37,568,000 68.9% $38,690,000 68.9% $39,811,000 68.9%Food & Beverage 15,094,000 29.4% 15,547,000 29.4% 16,013,000 29.4% 16,494,000 29.4% 16,988,000 29.4%Other Operated Departments 533,000 1.0% 549,000 1.0% 565,000 1.0% 582,000 1.0% 600,000 1.0%Rentals <strong>and</strong> Other Income 355,000 0.7% 366,000 0.7% 377,000 0.7% 388,000 0.7% 400,000 0.7%Total Revenues 51,307,000 100.0% 52,909,000 100.0% 54,523,000 100.0% 56,154,000 100.0% 57,799,000 100.0%Departmental ExpensesRooms 7,458,000 21.1% 7,682,000 21.1% 7,912,000 21.1% 8,150,000 21.1% 8,394,000 21.1%Food & Beverage 9,811,000 65.0% 10,105,000 65.0% 10,409,000 65.0% 10,721,000 65.0% 11,042,000 65.0%Other Operated Departments 426,000 79.9% 439,000 80.0% 452,000 80.0% 466,000 80.1% 480,000 80.0%Total Departmental Expenses 17,695,000 34.5% 18,226,000 34.4% 18,773,000 34.4% 19,337,000 34.4% 19,916,000 34.5%Departmental Profit 33,612,000 65.5% 34,683,000 65.6% 35,750,000 65.6% 36,817,000 65.6% 37,883,000 65.5%Undistributed ExpensesAdministrative & General 3,922,000 7.6% 4,042,000 7.6% 4,164,000 7.6% 4,288,000 7.6% 4,416,000 7.6%<strong>Market</strong>ing 3,747,000 7.3% 3,860,000 7.3% 3,976,000 7.3% 4,095,000 7.3% 4,218,000 7.3%Property Operation <strong>and</strong> Maintenance 1,841,000 3.6% 1,896,000 3.6% 1,953,000 3.6% 2,012,000 3.6% 2,072,000 3.6%Utility Costs 1,644,000 3.2% 1,693,000 3.2% 1,744,000 3.2% 1,796,000 3.2% 1,850,000 3.2%Total Undistributed Operating Expenses 11,154,000 21.7% 11,491,000 21.7% 11,837,000 21.7% 12,191,000 21.7% 12,556,000 21.7%Gross Operating Profit 22,458,000 43.8% 23,192,000 43.8% 23,913,000 43.9% 24,626,000 43.9% 25,327,000 43.8%Base Management Fee 1,417,000 2.8% 1,461,000 2.8% 1,505,000 2.8% 1,546,000 2.8% 1,592,000 2.8%Fixed ExpensesProperty Taxes 0 0.0% 0 0.0% 0 0.0% 0 0.0% 0 0.0%Insurance 493,000 1.0% 508,000 1.0% 523,000 1.0% 539,000 1.0% 555,000 1.0%Total Fixed Expenses 493,000 1.0% 508,000 1.0% 523,000 1.0% 539,000 1.0% 555,000 1.0%Net Operating Income 20,548,000 40.0% 21,223,000 40.1% 21,885,000 40.1% 22,541,000 40.1% 23,180,000 40.1%FF&E Reserve 3,078,000 6.0% 3,175,000 6.0% 3,271,000 6.0% 3,369,000 6.0% 3,468,000 6.0%Net Operating Income After Reserve $17,470,000 34.0% $18,048,000 34.1% $18,614,000 34.1% $19,172,000 34.1% $19,712,000 34.1%Subordinate FeesSubordinate Management Fee $472,000 0.9% $487,000 0.9% $502,000 0.9% $515,000 0.9% $531,000 0.9%Subordinate CapEx Reserve $513,000 1.0% $1,058,000 2.0% $1,090,000 2.0% $1,685,000 3.0% $1,734,000 3.0%Total Senior Fees $985,000 1.9% $1,545,000 2.9% $1,592,000 2.9% $2,200,000 3.9% $2,265,000 3.9%Net Operating Income After Subordinate Fees $16,485,000 32.1% $16,503,000 31.2% $17,022,000 31.2% $16,972,000 30.2% $17,447,000 30.2%Source: <strong>PKF</strong> Consulting USAV-29