PKF Hotel Market Demand and Financial Analysis - DIA Business ...
PKF Hotel Market Demand and Financial Analysis - DIA Business ...
PKF Hotel Market Demand and Financial Analysis - DIA Business ...

Create successful ePaper yourself
Turn your PDF publications into a flip-book with our unique Google optimized e-Paper software.
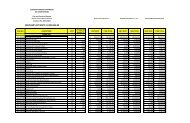
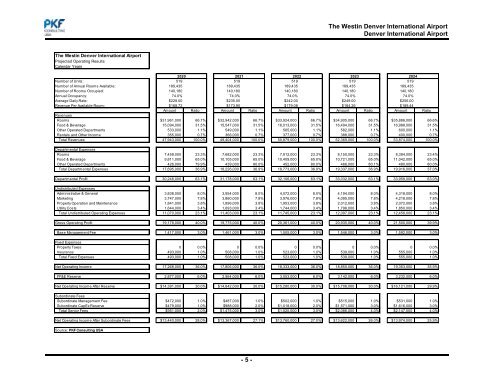
The Westin Denver International AirportDenver International AirportThe Westin Denver International AirportProjected Operating ResultsCalendar Years2020 2021 2022 20232024Number of Units: 519 519 519 519 519Number of Annual Rooms Available: 189,435 189,435 189,435 189,435 189,435Number of Rooms Occupied: 140,180 140,180 140,180 140,180 140,180Annual Occupancy: 74.0% 74.0% 74.0% 74.0% 74.0%Average Daily Rate: $228.00 $235.00 $242.00 $249.00 $256.00Revenue Per Available Room: $168.72 $173.90 $179.08 $184.26 $189.44Amount Ratio Amount Ratio Amount Ratio Amount Ratio Amount RatioRevenuesRooms $31,961,000 66.7% $32,942,000 66.7% $33,924,000 66.7% $34,905,000 66.7% $35,886,000 66.6%Food & Beverage 15,094,000 31.5% 15,547,000 31.5% 16,013,000 31.5% 16,494,000 31.5% 16,988,000 31.5%Other Operated Departments 533,000 1.1% 549,000 1.1% 565,000 1.1% 582,000 1.1% 600,000 1.1%Rentals <strong>and</strong> Other Income 355,000 0.7% 366,000 0.7% 377,000 0.7% 388,000 0.7% 400,000 0.7%Total Revenues 47,943,000 100.0% 49,404,000 100.0% 50,879,000 100.0% 52,369,000 100.0% 53,874,000 100.0%Departmental ExpensesRooms 7,458,000 23.3% 7,682,000 23.3% 7,912,000 23.3% 8,150,000 23.3% 8,394,000 23.4%Food & Beverage 9,811,000 65.0% 10,105,000 65.0% 10,409,000 65.0% 10,721,000 65.0% 11,042,000 65.0%Other Operated Departments 426,000 79.9% 439,000 80.0% 452,000 80.0% 466,000 80.1% 480,000 80.0%Total Departmental Expenses 17,695,000 36.9% 18,226,000 36.9% 18,773,000 36.9% 19,337,000 36.9% 19,916,000 37.0%Departmental Profit 30,248,000 63.1% 31,178,000 63.1% 32,106,000 63.1% 33,032,000 63.1% 33,958,000 63.0%Undistributed ExpensesAdministrative & General 3,838,000 8.0% 3,954,000 8.0% 4,072,000 8.0% 4,194,000 8.0% 4,318,000 8.0%<strong>Market</strong>ing 3,747,000 7.8% 3,860,000 7.8% 3,976,000 7.8% 4,095,000 7.8% 4,218,000 7.8%Property Operation <strong>and</strong> Maintenance 1,841,000 3.8% 1,896,000 3.8% 1,953,000 3.8% 2,012,000 3.8% 2,072,000 3.8%Utility Costs 1,644,000 3.4% 1,693,000 3.4% 1,744,000 3.4% 1,796,000 3.4% 1,850,000 3.4%Total Undistributed Operating Expenses 11,070,000 23.1% 11,403,000 23.1% 11,745,000 23.1% 12,097,000 23.1% 12,458,000 23.1%Gross Operating Profit 19,178,000 40.0% 19,775,000 40.0% 20,361,000 40.0% 20,935,000 40.0% 21,500,000 39.9%Base Management Fee 1,417,000 3.0% 1,461,000 3.0% 1,505,000 3.0% 1,546,000 3.0% 1,592,000 3.0%Fixed ExpensesProperty Taxes 0 0.0% 0 0.0% 0 0.0% 0 0.0% 0 0.0%Insurance 493,000 1.0% 508,000 1.0% 523,000 1.0% 539,000 1.0% 555,000 1.0%Total Fixed Expenses 493,000 1.0% 508,000 1.0% 523,000 1.0% 539,000 1.0% 555,000 1.0%Net Operating Income 17,268,000 36.0% 17,806,000 36.0% 18,333,000 36.0% 18,850,000 36.0% 19,353,000 35.9%FF&E Reserve 2,877,000 6.0% 2,964,000 6.0% 3,053,000 6.0% 3,142,000 6.0% 3,232,000 6.0%Net Operating Income After Reserve $14,391,000 30.0% $14,842,000 30.0% $15,280,000 30.0% $15,708,000 30.0% $16,121,000 29.9%Subordinate FeesSubordinate Management Fee $472,000 1.0% $487,000 1.0% $502,000 1.0% $515,000 1.0% $531,000 1.0%Subordinate CapEx Reserve $479,000 1.0% $988,000 2.0% $1,018,000 2.0% $1,571,000 3.0% $1,616,000 3.0%Total Senior Fees $951,000 2.0% $1,475,000 3.0% $1,520,000 3.0% $2,086,000 4.0% $2,147,000 4.0%Net Operating Income After Subordinate Fees $13,440,000 28.0% $13,367,000 27.1% $13,760,000 27.0% $13,622,000 26.0% $13,974,000 25.9%Source: <strong>PKF</strong> Consulting USA- 5 -