

Review of 2012 â EUR - Skanska
Review of 2012 â EUR - Skanska
Review of 2012 â EUR - Skanska

You also want an ePaper? Increase the reach of your titles
YUMPU automatically turns print PDFs into web optimized ePapers that Google loves.
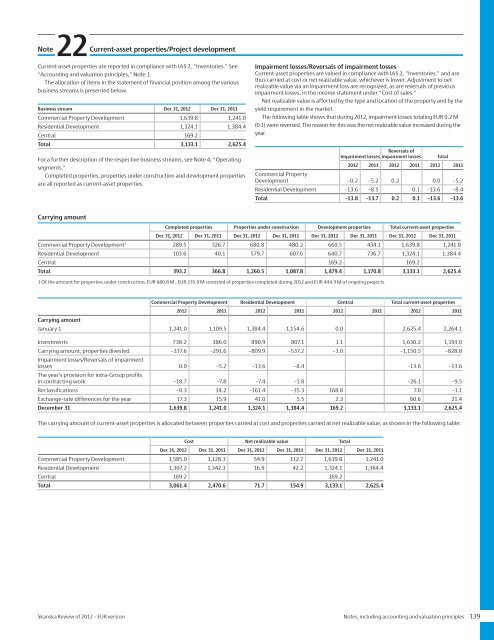
Note22Current-asset properties/Project developmentCurrent-asset properties are reported in compliance with IAS 2, “Inventories.” See“Accounting and valuation principles,” Note 1.The allocation <strong>of</strong> items in the statement <strong>of</strong> financial position among the variousbusiness streams is presented below.Business stream Dec 31, <strong>2012</strong> Dec 31, 2011Commercial Property Development 1,639.8 1,241.0Residential Development 1,324.1 1,384.4Central 169.2Total 3,133.1 2,625.4For a further description <strong>of</strong> the respective business streams, see Note 4, “Operatingsegments.”Completed properties, properties under construction and development propertiesare all reported as current-asset properties.Impairment losses/Reversals <strong>of</strong> impairment lossesCurrent-asset properties are valued in compliance with IAS 2, “Inventories,” and arethus carried at cost or net realizable value, whichever is lower. Adjustment to netrealizable value via an impairment loss are recognized, as are reversals <strong>of</strong> previousimpairment losses, in the income statement under “Cost <strong>of</strong> sales.”Net realizable value is affected by the type and location <strong>of</strong> the property and by theyield requirement in the market.The following table shows that during <strong>2012</strong>, impairment losses totaling <strong>EUR</strong> 0.2 M(0.1) were reversed. The reason for this was the net realizable value increased during theyear.Reversals <strong>of</strong>Impairment losses impairment losses Total<strong>2012</strong> 2011 <strong>2012</strong> 2011 <strong>2012</strong> 2011Commercial PropertyDevelopment –0.2 –5.2 0.2 0.0 –5.2Residential Development –13.6 –8.5 0.1 –13.6 –8.4Total –13.8 –13.7 0.2 0.1 –13.6 –13.6Carrying amountCompleted properties Properties under construction Development properties Total current-asset propertiesDec 31, <strong>2012</strong> Dec 31, 2011 Dec 31, <strong>2012</strong> Dec 31, 2011 Dec 31, <strong>2012</strong> Dec 31, 2011 Dec 31, <strong>2012</strong> Dec 31, 2011Commercial Property Development 1 289.5 326.7 680.8 480.2 669.5 434.1 1,639.8 1,241.0Residential Development 103.6 40.1 579.7 607.6 640.7 736.7 1,324.1 1,384.4Central 169.2 169.2Total 393.2 366.8 1,260.5 1,087.8 1,479.4 1,170.8 3,133.1 2,625.41 Of the amount for properties under construction, <strong>EUR</strong> 680.8 M , <strong>EUR</strong> 235.9 M consisted <strong>of</strong> properties completed during <strong>2012</strong> and <strong>EUR</strong> 444.9 M <strong>of</strong> ongoing projects.Commercial Property Development Residential Development Central Total current-asset properties<strong>2012</strong> 2011 <strong>2012</strong> 2011 <strong>2012</strong> 2011 <strong>2012</strong> 2011Carrying amountJanuary 1 1,241.0 1,109.5 1,384.4 1,154.6 0.0 2,625.4 2,264.1Investments 738.2 386.0 890.9 807.1 1.1 1,630.2 1,193.0Carrying amount, properties divested –337.6 –291.6 –809.9 –537.2 –3.0 –1,150.5 –828.8Impairment losses/Reversals <strong>of</strong> impairmentlosses 0.0 –5.2 –13.6 –8.4 –13.6 –13.6The year’s provision for intra-Group pr<strong>of</strong>itsin contracting work –18.7 –7.8 –7.4 –1.8 –26.1 –9.5Reclassifications –0.3 34.2 –161.4 –35.3 168.8 7.0 –1.1Exchange-rate differences for the year 17.3 15.9 41.0 5.5 2.3 60.6 21.4December 31 1,639.8 1,241.0 1,324.1 1,384.4 169.2 3,133.1 2,625.4The carrying amount <strong>of</strong> current-asset properties is allocated between properties carried at cost and properties carried at net realizable value, as shown in the following table:Cost Net realizable value TotalDec 31, <strong>2012</strong> Dec 31, 2011 Dec 31, <strong>2012</strong> Dec 31, 2011 Dec 31, <strong>2012</strong> Dec 31, 2011Commercial Property Development 1,585.0 1,128.3 54.9 112.7 1,639.8 1,241.0Residential Development 1,307.2 1,342.3 16.9 42.2 1,324.1 1,384.4Central 169.2 169.2Total 3,061.4 2,470.6 71.7 154.9 3,133.1 2,625.4<strong>Skanska</strong> <strong>Review</strong> <strong>of</strong> <strong>2012</strong> – <strong>EUR</strong> version Notes, including accounting and valuation principles 139


