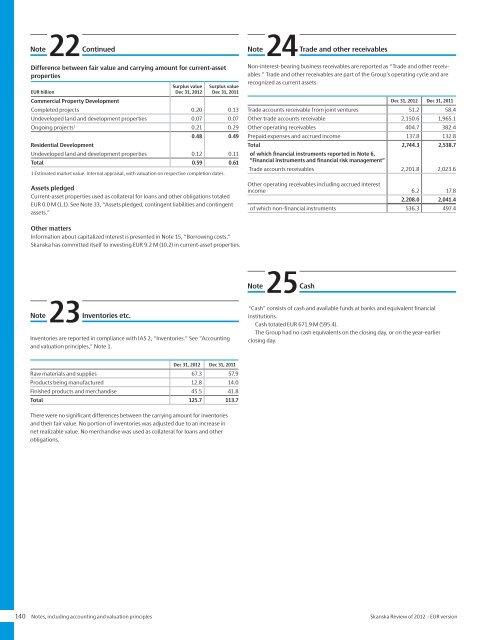
22NoteContinuedNoteDifference between fair value and carrying amount for current-assetproperties<strong>EUR</strong> billionSurplus valueDec 31, <strong>2012</strong>Surplus valueDec 31, 2011Commercial Property DevelopmentCompleted projects 0.20 0.13Undeveloped land and development properties 0.07 0.07Ongoing projects 1 0.21 0.290.48 0.49Residential DevelopmentUndeveloped land and development properties 0.12 0.11Total 0.59 0.611 Estimated market value. Internal appraisal, with valuation on respective completion dates.Assets pledgedCurrent-asset properties used as collateral for loans and other obligations totaled<strong>EUR</strong> 0.0 M (1.1). See Note 33, “Assets pledged, contingent liabilities and contingentassets.”24Trade and other receivablesNon-interest-bearing business receivables are reported as “Trade and other receivables.”Trade and other receivables are part <strong>of</strong> the Group’s operating cycle and arerecognized as current assets.Dec 31, <strong>2012</strong> Dec 31, 2011Trade accounts receivable from joint ventures 51.2 58.4Other trade accounts receivable 2,150.6 1,965.1Other operating receivables 404.7 382.4Prepaid expenses and accrued income 137.8 132.8Total 2,744.3 2,538.7<strong>of</strong> which financial instruments reported in Note 6,“Financial instruments and financial risk management”Trade accounts receivables 2,201.8 2,023.6Other operating receivables including accrued interestincome 6.2 17.82,208.0 2,041.4<strong>of</strong> which non-financial instruments 536.3 497.4Other mattersInformation about capitalized interest is presented in Note 15, “Borrowing costs.”<strong>Skanska</strong> has committed itself to investing <strong>EUR</strong> 9.2 M (10.2) in current-asset properties.Note23Inventories etc.Inventories are reported in compliance with IAS 2, “Inventories.” See “Accountingand valuation principles,” Note 1.Note25Cash“Cash” consists <strong>of</strong> cash and available funds at banks and equivalent financialinstitutions.Cash totaled <strong>EUR</strong> 671.9 M (595.4).The Group had no cash equivalents on the closing day, or on the year-earlierclosing day.Dec 31, <strong>2012</strong> Dec 31, 2011Raw materials and supplies 67.3 57.9Products being manufactured 12.8 14.0Finished products and merchandise 45.5 41.8Total 125.7 113.7There were no significant differences between the carrying amount for inventoriesand their fair value. No portion <strong>of</strong> inventories was adjusted due to an increase innet realizable value. No merchandise was used as collateral for loans and otherobligations.140 Notes, including accounting and valuation principles <strong>Skanska</strong> <strong>Review</strong> <strong>of</strong> <strong>2012</strong> – <strong>EUR</strong> version
Note26Equity/Earnings per shareIn the consolidated financial statements, equity is allocated between equity attributableto equity holders (shareholders) and non-controlling interests (minorityinterest).Non-controlling interests comprised about one percent <strong>of</strong> total equity.Equity changed during the year as follows:<strong>2012</strong> 2011Opening balance 2,196.1 2,306.9<strong>of</strong> which non-controlling interests 19.2 13.9Total comprehensive income for the yearPr<strong>of</strong>it for the year attributable to:Equity holders 327.7 840.5Non-controlling interests 0.9 0.7Other comprehensive incomeTranslation differences attributable to equityholders 1 58.2 –21.6Translation differences attributable tonon-controlling interests –0.5 –0.1Hedging <strong>of</strong> exchange-rate risk in foreignoperations 1 –11.4 5.8Effect <strong>of</strong> cash-flow hedges 2 –4.8 –146.9Effect <strong>of</strong> actuarial gains and losses on pensions 3 –14.9 –344.0Tax attributable to other comprehensive incomerelated to cash-flow hedges 2 –0.1 6.3related to actuarial gains and losses 3, 4 –10.2 89.816.3 –410.7Total comprehensive income for the year 344.9 430.5<strong>of</strong> which attributable to equity holders 344.5 430.0<strong>of</strong> which attributable to non-controllinginterests 0.5 0.5Other changes in equity not included in totalcomprehensive income for the yearDividend to equity holders –283.9 –547.7Dividend to non-controlling interests –0.9 –0.2Change in Group structure 0.0 1.8Effect <strong>of</strong> share-based payments 27.6 25.3Repurchases <strong>of</strong> shares –30.1 –20.4–287.3 –541.3Equity, December 31 2,253.7 2,196.1<strong>of</strong> which non-controlling interests 18.8 19.21 Translation differences attributable to equity holders, <strong>EUR</strong> 58.2 M (–21.6) plus hedging <strong>of</strong>exchange-rate risk in foreign operations, <strong>EUR</strong> –11.4 M (5.8), totaling <strong>EUR</strong> 46.8 M (–15.8), comprisethe Group’s change in translation reserve.2 Effect <strong>of</strong> cash-flow hedges, <strong>EUR</strong> –4.8 M (–146.9), together with tax, <strong>EUR</strong> –0.1 M (6.3), totaling<strong>EUR</strong> –4.9 M (–140.6) comprise the Group’s change in cash-flow hedge reserve.3 Effect <strong>of</strong> actuarial gains and losses on pensions, <strong>EUR</strong> –14.9 M (–344.0), together with tax,<strong>EUR</strong> –10.2 M (89.8), totaling <strong>EUR</strong> –25.2 M (–254.2) comprise the Group’s total effect on equity <strong>of</strong>pensions recognized in compliance with IAS 19 and are recognized in retained earnings.4 The tax rate in Sweden was lowered from 26.3 percent to 22.0 percent, effective as <strong>of</strong> January 1,2013. <strong>Skanska</strong> reports its deferred tax assets as the difference between pension liabilities calculatedin accordance with IAS 19 and pension liabilities calculated in accordance with the localregulations <strong>of</strong> each country. The reduced tax rate for Swedish companies means a reduction as<strong>of</strong> December 31, <strong>2012</strong>, <strong>of</strong> <strong>EUR</strong> 14.8 M in the carrying amount for deferred tax assets related topensions, including special employer’s contribution. The difference between pension liabilitiescalculated in accordance with IAS 19 and pension liabilities calculated in accordance with localregulations is recognized under “Other comprehensive income,” which means that this reduction<strong>of</strong> deferred tax assets is also recognized under “Other comprehensive income” and included inchanges for the year.Equity attributable to equity holders is allocated as follows:Dec 31, <strong>2012</strong> Dec 31, 2011Share capital 138.9 138.9Paid-in capital 127.5 99.9Reserves –35.3 –77.1Retained earnings 2,003.9 2,015.3Total 2,235.0 2,176.9Paid-in capitalPaid-in capital in excess <strong>of</strong> quota (par) value from historical issues <strong>of</strong> new shares isrecognized as “Paid-in capital.”The change during <strong>2012</strong> and 2011 was attributable to share-based payments andamounted to <strong>EUR</strong> 27.6 M (25.3).Reserves <strong>2012</strong> 2011Translation reserve 153.3 106.5Cash-flow hedge reserve –188.6 –183.6Total –35.3 –77.1Reconciliation <strong>of</strong> reservesTranslation reserveJanuary 1 106.5 122.4Translation differences for the year 58.2 –21.6Minus hedging on foreign-exchange rate risk inoperations outside Sweden –11.4 5.8153.3 106.5Cash-flow hedge reserveJanuary 1 –183.7 –43.1Cash-flow hedges recognized in othercomprehensive income:Hedges for the year –54.3 –136.6Transferred to the income statement 49.5 –10.3Taxes attributable to hedging for the year –0.1 6.3–188.6 –183.7Total reserves –35.3 –77.1Translation reserveThe translation reserve comprises accumulated translation differences from thetranslation <strong>of</strong> financial reports for operations abroad. The translation reserve alsoincludes exchange-rate differences that have arisen when hedging net investmentsin operations abroad. The translation reserve was reset at zero upon the transition toIFRSs on January 1, 2004.Translation differences for the year amounted to <strong>EUR</strong> 58.2 M (–21.6) and consisted<strong>of</strong> negative translation differences in USD, ARS, CLP and BRL, as well as a positivetranslation differences in SEK, GBP, NOK, CZK and PLN (for currency abbreviations,refer to Note 34, “Effect <strong>of</strong> changes in foreign-exchange rates”).During <strong>2012</strong>, the translation reserve was affected by exchange-rate differences <strong>of</strong><strong>EUR</strong> –11.4 M (5.8) due to currency hedging.The Group has currency hedges against net investments mainly in USD, <strong>EUR</strong>, NOK,CZK, PLN and CLP.The accumulated translation reserve totaled <strong>EUR</strong> 153.3 M (106.5).Cash-flow hedge reserveHedge accounting is applied mainly to Infrastructure Development.Recognized in the cash-flow hedge reserve are unrealized gains and losses on hedginginstruments. The change during <strong>2012</strong> amounted to <strong>EUR</strong> –4.9 M (–140.5), and theclosing balance <strong>of</strong> the reserve totaled <strong>EUR</strong> –188.6 M (–183.7).Retained earningsRetained earnings include the pr<strong>of</strong>it for the year plus undistributed Group pr<strong>of</strong>itsearned in prior years. The statutory reserve is part <strong>of</strong> retained earnings, along withactuarial gains and losses on pensions, which in compliance with IAS 19 was recognizedunder “Other comprehensive income.”<strong>Skanska</strong> <strong>Review</strong> <strong>of</strong> <strong>2012</strong> – <strong>EUR</strong> version Notes, including accounting and valuation principles 141
- Page 1:
Review of 2012EUR version
- Page 4 and 5:
Skanska’s strengthsPositions Empl
- Page 6 and 7:
2012 in briefFirst quarterSecond qu
- Page 8 and 9:
Comments by the President and CEOTh
- Page 10 and 11:
MissionSkanska’s mission isto dev
- Page 12 and 13:
◀◀◀◀◀Business modelProjec
- Page 14 and 15:
Financial targetsSkanska’s busine
- Page 16 and 17:
Risk managementThe continuous stren
- Page 18 and 19:
30,000potential projects analyzed e
- Page 20 and 21:
Skanska’s role in the communitySk
- Page 22 and 23:
-100of thousands of people get invo
- Page 24 and 25:
Earnings are generated by peopleCom
- Page 26 and 27:
22,000employees are developed each
- Page 28 and 29:
Share dataFor more than ten years,
- Page 30 and 31:
Growth in equityDividends re-invest
- Page 32 and 33:
ConstructionThe Värtan Interchange
- Page 34 and 35:
Increased revenues and strong order
- Page 36 and 37:
Nordic countriesSwedenNorwayFinland
- Page 38 and 39:
StatoilBuilt by: Skanska NorwayCust
- Page 40 and 41:
Other European countriesPolandCzech
- Page 42 and 43:
Cross London Rail Links - Cross Rai
- Page 44 and 45:
The AmericasUSA BuildingUSA CivilLa
- Page 46 and 47:
High pace forhigher education
- Page 48 and 49:
Residential DevelopmentContinued gr
- Page 50 and 51:
Enhancing efficiency in the Nordic
- Page 52 and 53:
Nordic countriesSwedenNorwayFinland
- Page 54 and 55:
Other European countriesPolandCzech
- Page 56 and 57:
Commercial Property DevelopmentFull
- Page 58 and 59:
Profitable property divestments yea
- Page 60 and 61:
Nordic countriesSwedenNorwayFinland
- Page 62 and 63:
Other European countriesPolandCzech
- Page 64 and 65:
Strong expansionin PolandPoznańWar
- Page 66 and 67:
United StatesIn the U.S., Skanska i
- Page 68 and 69:
Infrastructure DevelopmentOne of Lo
- Page 70 and 71:
Improved conditions for new project
- Page 72 and 73:
Project portfolioSkanska’s Infras
- Page 74 and 75:
Elizabeth River Tunnels(Downtown Tu
- Page 76 and 77:
Sustainable developmentSustainable
- Page 78 and 79:
We play fairSkanska Czech Republic
- Page 80 and 81:
Väla Gård, Helsingborg, SwedenVä
- Page 82 and 83:
WasteSkanska’s targets for waste
- Page 84 and 85:
Global leadershipRecognitionSkanska
- Page 86 and 87:
Financial review 2012Revenue showed
- Page 88 and 89:
Operating incomeEUR M 2012 2011Oper
- Page 90 and 91:
Investments/DivestmentsEUR M 2012 2
- Page 92 and 93:
Greater standardization, with short
- Page 94 and 95: NominationCommitteeCompensationComm
- Page 96 and 97: The President and CEO and the eight
- Page 98 and 99: term balance between financial resu
- Page 100 and 101: The allotment of shares earned by t
- Page 102 and 103: Consolidated statement of comprehen
- Page 104 and 105: Consolidated statement of financial
- Page 106 and 107: Consolidated cash flow statementCha
- Page 108 and 109: Notes including accounting and valu
- Page 110 and 111: Note01ContinuedEquityThe Group’s
- Page 112 and 113: 01NoteContinuedhanded over to the c
- Page 114 and 115: 01NoteContinuedwhich means that a p
- Page 116 and 117: Note01Continuedwere an independent
- Page 118 and 119: 02NoteKey estimates and judgmentsKe
- Page 120 and 121: Note04Continued2011 ConstructionRes
- Page 122 and 123: 06NoteFinancial instruments and fin
- Page 124 and 125: 06NoteContinuedContracted net flows
- Page 126 and 127: 06NoteContinuedReconciliation with
- Page 128 and 129: 06NoteContinuedImpact of financial
- Page 130 and 131: 07NoteContinuedPurchase price alloc
- Page 132 and 133: 08NoteContinuedRevenue by category2
- Page 134 and 135: Note14Net financial items2012 2011F
- Page 136 and 137: Note17Property, plant and equipment
- Page 138 and 139: Note19Intangible assetsIntangible a
- Page 140 and 141: 20NoteContinuedInfrastructure Devel
- Page 142 and 143: Note21FinancialassetsFinancial inve
- Page 146 and 147: 26NoteContinuedActuarial gains and
- Page 148 and 149: 28NoteContinuedPlan assetsSweden No
- Page 150 and 151: Note29ProvisionsProvisions are repo
- Page 152 and 153: Note32Expected recovery periods of
- Page 154 and 155: 34NoteForeign-exchange rates and ef
- Page 156 and 157: Note35Cash-flow statementAside from
- Page 158 and 159: Note36PersonnelWages, salaries, oth
- Page 160 and 161: Note37ContinuedIn addition to the a
- Page 162 and 163: Note37ContinuedFinancial targets fo
- Page 164 and 165: Note42Consolidatedquarterly results
- Page 166 and 167: 43NoteFive-year Group financial sum
- Page 168 and 169: Note43ContinuedFinancial ratios etc
- Page 170 and 171: Note45Supplementary information, Pa
- Page 172 and 173: Independent Auditors’ ReportTo th
- Page 174 and 175: Senior Executive TeamPositionJohan
- Page 176 and 177: Board of directorsStuart E. Graham
- Page 178 and 179: Major events during 2012This page s
- Page 180 and 181: Below are the investments and dives
- Page 182 and 183: Definitions and explanationsAverage
- Page 184 and 185: Annual Shareholders’ MeetingInves