

Review of 2012 â EUR - Skanska
Review of 2012 â EUR - Skanska
Review of 2012 â EUR - Skanska

Create successful ePaper yourself
Turn your PDF publications into a flip-book with our unique Google optimized e-Paper software.
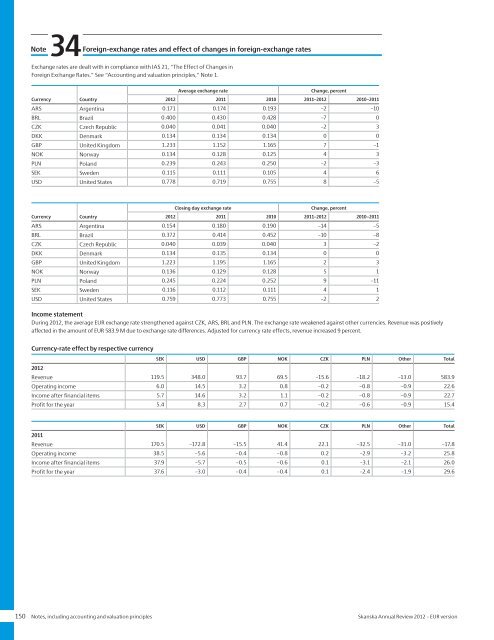
34NoteForeign-exchange rates and effect <strong>of</strong> changes in foreign-exchange ratesExchange rates are dealt with in compliance with IAS 21, “The Effect <strong>of</strong> Changes inForeign Exchange Rates.” See “Accounting and valuation principles,” Note 1.Average exchange rateChange, percentCurrency Country <strong>2012</strong> 2011 2010 2011–<strong>2012</strong> 2010–2011ARS Argentina 0.171 0.174 0.193 –2 –10BRL Brazil 0.400 0.430 0.428 –7 0CZK Czech Republic 0.040 0.041 0.040 –2 3DKK Denmark 0.134 0.134 0.134 0 0GBP United Kingdom 1.233 1.152 1.165 7 –1NOK Norway 0.134 0.128 0.125 4 3PLN Poland 0.239 0.243 0.250 –2 –3SEK Sweden 0.115 0.111 0.105 4 6USD United States 0.778 0.719 0.755 8 –5Closing day exchange rateChange, percentCurrency Country <strong>2012</strong> 2011 2010 2011–<strong>2012</strong> 2010–2011ARS Argentina 0.154 0.180 0.190 –14 –5BRL Brazil 0.372 0.414 0.452 –10 –8CZK Czech Republic 0.040 0.039 0.040 3 –2DKK Denmark 0.134 0.135 0.134 0 0GBP United Kingdom 1.223 1.195 1.165 2 3NOK Norway 0.136 0.129 0.128 5 1PLN Poland 0.245 0.224 0.252 9 –11SEK Sweden 0.116 0.112 0.111 4 1USD United States 0.759 0.773 0.755 –2 2Income statementDuring <strong>2012</strong>, the average <strong>EUR</strong> exchange rate strengthened against CZK, ARS, BRL and PLN. The exchange rate weakened against other currencies. Revenue was positivelyaffected in the amount <strong>of</strong> <strong>EUR</strong> 583.9 M due to exchange rate differences. Adjusted for currency rate effects, revenue increased 9 percent.Currency-rate effect by respective currencySEK USD GBP NOK CZK PLN Other Total<strong>2012</strong>Revenue 119.5 348.0 93.7 69.5 –15.6 –18.2 –13.0 583.9Operating income 6.0 14.5 3.2 0.8 –0.2 –0.8 –0.9 22.6Income after financial items 5.7 14.6 3.2 1.1 –0.2 –0.8 –0.9 22.7Pr<strong>of</strong>it for the year 5.4 8.3 2.7 0.7 –0.2 –0.6 –0.9 15.4SEK USD GBP NOK CZK PLN Other Total2011Revenue 170.5 –172.8 –15.5 41.4 22.1 –32.5 –31.0 –17.8Operating income 38.5 –5.6 –0.4 –0.8 0.2 –2.9 –3.2 25.8Income after financial items 37.9 –5.7 –0.5 –0.6 0.1 –3.1 –2.1 26.0Pr<strong>of</strong>it for the year 37.6 –3.0 –0.4 –0.4 0.1 –2.4 –1.9 29.6150 Notes, including accounting and valuation principles <strong>Skanska</strong> Annual <strong>Review</strong> <strong>2012</strong> – <strong>EUR</strong> version


