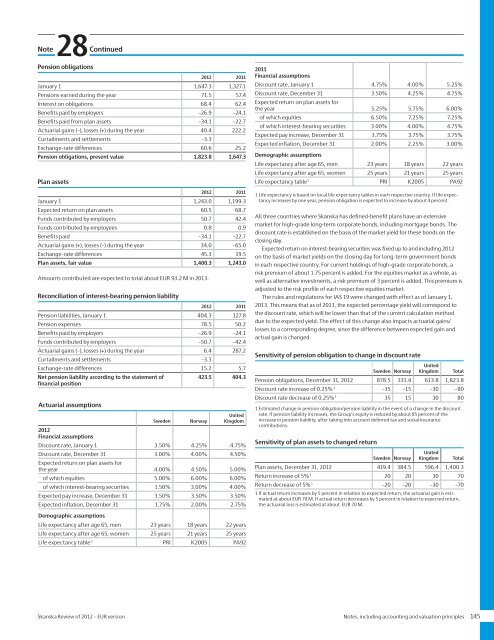
28NoteContinuedPlan assetsSweden Norway United Kingdom<strong>2012</strong>Equities 30% 35% 32%Interest-bearing securities 29% 48% 47%Alternative investments 41% 17% 21%Expected return 4.00% 4.50% 5.00%Actual return 5.80% 8.60% 7.30%2011Equities 25% 35% 38%Interest-bearing securities 32% 50% 48%Alternative investments 43% 15% 14%Expected return 5.25% 5.75% 6.00%Actual return –0.70% –3.80% 4.30%The ITP 1 occupational pension plan in Sweden is a defined-contribution plan.<strong>Skanska</strong> pays premiums for employees covered by ITP 1, and each employee selectsa manager. The Company <strong>of</strong>fers employees the opportunity to select <strong>Skanska</strong> asthe manager. For employees who have selected <strong>Skanska</strong> as their manager, there is aguaranteed minimum amount that the employee will receive upon retirement. Thisguarantee means that the portion <strong>of</strong> the ITP plan for which <strong>Skanska</strong> is the manager isrecognized as a defined-benefit plan. The net amount <strong>of</strong> obligations and plan assetsfor ITP 1 managed by <strong>Skanska</strong> is recognized in the Company’s statement <strong>of</strong> financialposition.The ITP 2 occupational pension plan in Sweden is a defined-benefit plan. A smallportion is secured by insurance from the retirement insurance company Alecta. Thisis a multi-employer insurance plan, and there is insufficient information to reportthese obligations as a defined-benefit plan. Pensions secured by insurance fromAlecta are therefore reported as a defined-contribution plan. At the close <strong>of</strong> <strong>2012</strong>,the collective consolidated level <strong>of</strong> defined-benefit plans in Alecta totaled 129percent (113). The collective consolidated level comprises assets as a percentage <strong>of</strong>actuarial obligations. The AFP plan in Norway also has a defined-benefit plan thatencompasses several employers, for which there is insufficient information to reportthese obligations as a defined-benefit plan. Consequently, these plans are alsoreported as a defined-contribution plan.Defined-contribution plansThese plans mainly cover retirement pension, disability pension and family pension.The premiums are paid regularly during the year by the respective Group companyto separate legal entities, for example insurance companies. The size <strong>of</strong> the premiumis based on salary. The pension expense for the period is included in the incomestatement.Obligations related to employee benefits, defined-benefit plans<strong>2012</strong> 2011 2010 2009 2008Pension obligations, fundedplans, present value onDecember 31 1,823.8 1,647.3 1,327.1 1,202.3 1,036.2Plan assets, fair value,December 31 –1,400.3 –1,243.0 –1,199.3 –986.9 –752.9Pension liability accordingto the statement <strong>of</strong> financialposition 423.5 404.3 127.8 215.4 283.3Pension obligations and plan assets by countrySweden NorwayUnitedKingdom Total<strong>2012</strong>Pension obligations 878.5 331.4 613.8 1,823.8Plan assets –419.4 –384.5 –596.4 –1,400.3Pension liability according to thestatement <strong>of</strong> financial position459.2 –53.1 17.5 423.52011Pension obligations 775.6 290.9 580.8 1,647.3Plan assets –397.6 –308.0 –537.5 –1,243.0Pension liability according to thestatement <strong>of</strong> financial position 378.0 –17.0 43.3 404.3Total pension expenses in the income statement<strong>2012</strong> 2011Pensions earned during the year –71.5 –57.4Less: Funds contributed by employees 0.8 0.9Interest on obligations –68.4 –62.4Expected return on plan assets 60.5 68.7Curtailments and settlements 1 3.3Pension expenses, defined-benefit plans –75.1 –50.2Pension expenses, defined-contribution plans –110.1 –86.8Social insurance contributions, defined-benefit anddefined-contribution plans 2 –14.4 –9.9Total pension expenses –199.5 –146.91 Refers to reductions in Residential Development in Sweden.2 Refers to special payroll tax in Sweden and employer fee in Norway.Allocation <strong>of</strong> pension expenses in the income statement<strong>2012</strong> 2011Cost <strong>of</strong> sales –147.4 –114.6Selling and administrative expenses –44.3 –38.5Net financial items –7.8 6.3Total pension expenses –199.5 –146.9Actuarial gains and losses recognized under othercomprehensive income<strong>2012</strong> 2011 2010 2009 2008January 1 –535.8 –248.6 –328.2 –393.1 –140.4Actuarial gains and losses onpension obligations 1 –40.4 –222.2 38.4 –8.8 –81.9Difference between expectedand actual return on planassets 34.0 –65.0 41.1 73.8 –170.9Accumulated –542.2 –535.8 –248.6 –328.2 –393.11 Allocation <strong>of</strong> changed assumptions and experience-based changes:<strong>2012</strong> 2011 2010 2009 2008Changed assumptions –36.2 –214.9 28.7 12.5 –67.1Experience-based changes –4.3 –7.3 9.7 –21.4 –14.8Total actuarial gains andlosses on pension obligations –40.4 –222.2 38.4 –8.8 –81.9See also Note 26, which shows the tax portion and social insurance contributionsrecognized under other comprehensive income.144 Notes, including accounting and valuation principles <strong>Skanska</strong> <strong>Review</strong> <strong>of</strong> <strong>2012</strong> – <strong>EUR</strong> version
28NoteContinuedPension obligations<strong>2012</strong> 2011January 1 1,647.3 1,327.1Pensions earned during the year 71.5 57.4Interest on obligations 68.4 62.4Benefits paid by employers –26.9 –24.1Benefits paid from plan assets –34.1 –22.7Actuarial gains (–), losses (+) during the year 40.4 222.2Curtailments and settlements –3.3Exchange-rate differences 60.6 25.2Pension obligations, present value 1,823.8 1,647.3Plan assets<strong>2012</strong> 2011January 1 1,243.0 1,199.3Expected return on plan assets 60.5 68.7Funds contributed by employers 50.7 42.4Funds contributed by employees 0.8 0.9Benefits paid –34.1 –22.7Actuarial gains (+), losses (–) during the year 34.0 –65.0Exchange-rate differences 45.3 19.5Plan assets, fair value 1,400.3 1,243.0Amounts contributed are expected to total about <strong>EUR</strong> 93.2 M in 2013.Reconciliation <strong>of</strong> interest-bearing pension liability<strong>2012</strong> 2011Pension liabilities, January 1 404.3 127.8Pension expenses 78.5 50.2Benefits paid by employers –26.9 –24.1Funds contributed by employers –50.7 –42.4Actuarial gains (–), losses (+) during the year 6.4 287.2Curtailments and settlements –3.3Exchange-rate differences 15.2 5.7Net pension liability according to the statement <strong>of</strong>financial position423.5 404.3Actuarial assumptionsSweden NorwayUnitedKingdom<strong>2012</strong>Financial assumptionsDiscount rate, January 1 3.50% 4.25% 4.75%Discount rate, December 31 3.00% 4.00% 4.50%Expected return on plan assets forthe year 4.00% 4.50% 5.00%<strong>of</strong> which equities 5.00% 6.00% 6.00%<strong>of</strong> which interest-bearing securities 1.50% 3.00% 4.00%Expected pay increase, December 31 3.50% 3.50% 3.50%Expected inflation, December 31 1.75% 2.00% 2.75%2011Financial assumptionsDiscount rate, January 1 4.75% 4.00% 5.25%Discount rate, December 31 3.50% 4.25% 4.75%Expected return on plan assets forthe year 5.25% 5.75% 6.00%<strong>of</strong> which equities 6.50% 7.25% 7.25%<strong>of</strong> which interest-bearing securities 3.00% 4.00% 4.75%Expected pay increase, December 31 3.75% 3.75% 3.75%Expected inflation, December 31 2.00% 2.25% 3.00%Demographic assumptionsLife expectancy after age 65, men 23 years 18 years 22 yearsLife expectancy after age 65, women 25 years 21 years 25 yearsLife expectancy table 1 PRI K2005 PA921 Life expectancy is based on local life expectancy tables in each respective country. If life expectancyincreases by one year, pension obligation is expected to increase by about 4 percent.All three countries where <strong>Skanska</strong> has defined-benefit plans have an extensivemarket for high-grade long-term corporate bonds, including mortgage bonds. Thediscount rate is established on the basis <strong>of</strong> the market yield for these bonds on theclosing day.Expected return on interest-bearing securities was fixed up to and including <strong>2012</strong>on the basis <strong>of</strong> market yields on the closing day for long-term government bondsin each respective country. For current holdings <strong>of</strong> high-grade corporate bonds, arisk premium <strong>of</strong> about 1.75 percent is added. For the equities market as a whole, aswell as alternative investments, a risk premium <strong>of</strong> 3 percent is added. This premium isadjusted to the risk pr<strong>of</strong>ile <strong>of</strong> each respective equities market.The rules and regulations for IAS 19 were changed with effect as <strong>of</strong> January 1,2013. This means that as <strong>of</strong> 2013, the expected percentage yield will correspond tothe discount rate, which will be lower than that <strong>of</strong> the current calculation methoddue to the expected yield. The effect <strong>of</strong> this change also impacts actuarial gains/losses to a corresponding degree, since the difference between expected gain andactual gain is changed.Sensitivity <strong>of</strong> pension obligation to change in discount rateSweden NorwayUnitedKingdom TotalPension obligations, December 31, <strong>2012</strong> 878.5 331.4 613.8 1,823.8Discount rate increase <strong>of</strong> 0.25% 1 –35 –15 –30 –80Discount rate decrease <strong>of</strong> 0.25% 1 35 15 30 801 Estimated change in pension obligation/pension liability in the event <strong>of</strong> a change in the discountrate. If pension liability increases, the Group’s equity is reduced by about 85 percent <strong>of</strong> theincrease in pension liability, after taking into account deferred tax and social insurancecontributions.Sensitivity <strong>of</strong> plan assets to changed returnSweden NorwayUnitedKingdom TotalPlan assets, December 31, <strong>2012</strong> 419.4 384.5 596.4 1,400.3Return increase <strong>of</strong> 5% 1 20 20 30 70Return decrease <strong>of</strong> 5% 1 –20 –20 –30 –701 If actual return increases by 5 percent in relation to expected return, the actuarial gain is estimatedat about <strong>EUR</strong> 70 M. If actual return decreases by 5 percent in relation to expected return,the actuarial loss is estimated at about <strong>EUR</strong> 70 M.Demographic assumptionsLife expectancy after age 65, men 23 years 18 years 22 yearsLife expectancy after age 65, women 25 years 21 years 25 yearsLife expectancy table 1 PRI K2005 PA92<strong>Skanska</strong> <strong>Review</strong> <strong>of</strong> <strong>2012</strong> – <strong>EUR</strong> version Notes, including accounting and valuation principles 145
- Page 1:
Review of 2012EUR version
- Page 4 and 5:
Skanska’s strengthsPositions Empl
- Page 6 and 7:
2012 in briefFirst quarterSecond qu
- Page 8 and 9:
Comments by the President and CEOTh
- Page 10 and 11:
MissionSkanska’s mission isto dev
- Page 12 and 13:
◀◀◀◀◀Business modelProjec
- Page 14 and 15:
Financial targetsSkanska’s busine
- Page 16 and 17:
Risk managementThe continuous stren
- Page 18 and 19:
30,000potential projects analyzed e
- Page 20 and 21:
Skanska’s role in the communitySk
- Page 22 and 23:
-100of thousands of people get invo
- Page 24 and 25:
Earnings are generated by peopleCom
- Page 26 and 27:
22,000employees are developed each
- Page 28 and 29:
Share dataFor more than ten years,
- Page 30 and 31:
Growth in equityDividends re-invest
- Page 32 and 33:
ConstructionThe Värtan Interchange
- Page 34 and 35:
Increased revenues and strong order
- Page 36 and 37:
Nordic countriesSwedenNorwayFinland
- Page 38 and 39:
StatoilBuilt by: Skanska NorwayCust
- Page 40 and 41:
Other European countriesPolandCzech
- Page 42 and 43:
Cross London Rail Links - Cross Rai
- Page 44 and 45:
The AmericasUSA BuildingUSA CivilLa
- Page 46 and 47:
High pace forhigher education
- Page 48 and 49:
Residential DevelopmentContinued gr
- Page 50 and 51:
Enhancing efficiency in the Nordic
- Page 52 and 53:
Nordic countriesSwedenNorwayFinland
- Page 54 and 55:
Other European countriesPolandCzech
- Page 56 and 57:
Commercial Property DevelopmentFull
- Page 58 and 59:
Profitable property divestments yea
- Page 60 and 61:
Nordic countriesSwedenNorwayFinland
- Page 62 and 63:
Other European countriesPolandCzech
- Page 64 and 65:
Strong expansionin PolandPoznańWar
- Page 66 and 67:
United StatesIn the U.S., Skanska i
- Page 68 and 69:
Infrastructure DevelopmentOne of Lo
- Page 70 and 71:
Improved conditions for new project
- Page 72 and 73:
Project portfolioSkanska’s Infras
- Page 74 and 75:
Elizabeth River Tunnels(Downtown Tu
- Page 76 and 77:
Sustainable developmentSustainable
- Page 78 and 79:
We play fairSkanska Czech Republic
- Page 80 and 81:
Väla Gård, Helsingborg, SwedenVä
- Page 82 and 83:
WasteSkanska’s targets for waste
- Page 84 and 85:
Global leadershipRecognitionSkanska
- Page 86 and 87:
Financial review 2012Revenue showed
- Page 88 and 89:
Operating incomeEUR M 2012 2011Oper
- Page 90 and 91:
Investments/DivestmentsEUR M 2012 2
- Page 92 and 93:
Greater standardization, with short
- Page 94 and 95:
NominationCommitteeCompensationComm
- Page 96 and 97:
The President and CEO and the eight
- Page 98 and 99: term balance between financial resu
- Page 100 and 101: The allotment of shares earned by t
- Page 102 and 103: Consolidated statement of comprehen
- Page 104 and 105: Consolidated statement of financial
- Page 106 and 107: Consolidated cash flow statementCha
- Page 108 and 109: Notes including accounting and valu
- Page 110 and 111: Note01ContinuedEquityThe Group’s
- Page 112 and 113: 01NoteContinuedhanded over to the c
- Page 114 and 115: 01NoteContinuedwhich means that a p
- Page 116 and 117: Note01Continuedwere an independent
- Page 118 and 119: 02NoteKey estimates and judgmentsKe
- Page 120 and 121: Note04Continued2011 ConstructionRes
- Page 122 and 123: 06NoteFinancial instruments and fin
- Page 124 and 125: 06NoteContinuedContracted net flows
- Page 126 and 127: 06NoteContinuedReconciliation with
- Page 128 and 129: 06NoteContinuedImpact of financial
- Page 130 and 131: 07NoteContinuedPurchase price alloc
- Page 132 and 133: 08NoteContinuedRevenue by category2
- Page 134 and 135: Note14Net financial items2012 2011F
- Page 136 and 137: Note17Property, plant and equipment
- Page 138 and 139: Note19Intangible assetsIntangible a
- Page 140 and 141: 20NoteContinuedInfrastructure Devel
- Page 142 and 143: Note21FinancialassetsFinancial inve
- Page 144 and 145: 22NoteContinuedNoteDifference betwe
- Page 146 and 147: 26NoteContinuedActuarial gains and
- Page 150 and 151: Note29ProvisionsProvisions are repo
- Page 152 and 153: Note32Expected recovery periods of
- Page 154 and 155: 34NoteForeign-exchange rates and ef
- Page 156 and 157: Note35Cash-flow statementAside from
- Page 158 and 159: Note36PersonnelWages, salaries, oth
- Page 160 and 161: Note37ContinuedIn addition to the a
- Page 162 and 163: Note37ContinuedFinancial targets fo
- Page 164 and 165: Note42Consolidatedquarterly results
- Page 166 and 167: 43NoteFive-year Group financial sum
- Page 168 and 169: Note43ContinuedFinancial ratios etc
- Page 170 and 171: Note45Supplementary information, Pa
- Page 172 and 173: Independent Auditors’ ReportTo th
- Page 174 and 175: Senior Executive TeamPositionJohan
- Page 176 and 177: Board of directorsStuart E. Graham
- Page 178 and 179: Major events during 2012This page s
- Page 180 and 181: Below are the investments and dives
- Page 182 and 183: Definitions and explanationsAverage
- Page 184 and 185: Annual Shareholders’ MeetingInves