

Review of 2012 â EUR - Skanska
Review of 2012 â EUR - Skanska
Review of 2012 â EUR - Skanska

You also want an ePaper? Increase the reach of your titles
YUMPU automatically turns print PDFs into web optimized ePapers that Google loves.
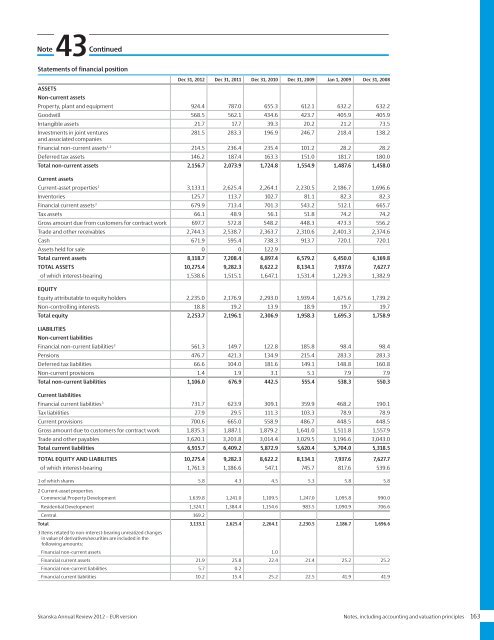
Note43ContinuedStatements <strong>of</strong> financial positionDec 31, <strong>2012</strong> Dec 31, 2011 Dec 31, 2010 Dec 31, 2009 Jan 1, 2009 Dec 31, 2008ASSETSNon-current assetsProperty, plant and equipment 924.4 787.0 655.3 612.1 632.2 632.2Goodwill 568.5 562.1 434.6 423.7 405.9 405.9Intangible assets 21.7 17.7 39.3 20.2 21.2 73.5Investments in joint ventures281.5 283.3 196.9 246.7 218.4 138.2and associated companiesFinancial non-current assets 1, 3 214.5 236.4 235.4 101.2 28.2 28.2Deferred tax assets 146.2 187.4 163.3 151.0 181.7 180.0Total non-current assets 2,156.7 2,073.9 1,724.8 1,554.9 1,487.6 1,458.0Current assetsCurrent-asset properties 2 3,133.1 2,625.4 2,264.1 2,230.5 2,186.7 1,696.6Inventories 125.7 113.7 102.7 81.1 82.3 82.3Financial current assets 3 679.9 713.4 701.3 543.2 512.1 665.7Tax assets 66.1 48.9 56.1 51.8 74.2 74.2Gross amount due from customers for contract work 697.7 572.8 548.2 448.3 473.3 556.2Trade and other receivables 2,744.3 2,538.7 2,363.7 2,310.6 2,401.3 2,374.6Cash 671.9 595.4 738.3 913.7 720.1 720.1Assets held for sale 0 0 122.9Total current assets 8,118.7 7,208.4 6,897.4 6,579.2 6,450.0 6,169.8TOTAL ASSETS 10,275.4 9,282.3 8,622.2 8,134.1 7,937.6 7,627.7<strong>of</strong> which interest-bearing 1,538.6 1,515.1 1,647.1 1,531.4 1,229.3 1,382.9EQUITYEquity attributable to equity holders 2,235.0 2,176.9 2,293.0 1,939.4 1,675.6 1,739.2Non-controlling interests 18.8 19.2 13.9 18.9 19.7 19.7Total equity 2,253.7 2,196.1 2,306.9 1,958.3 1,695.3 1,758.9LIABILITIESNon-current liabilitiesFinancial non-current liabilities 3 561.3 149.7 122.8 185.8 98.4 98.4Pensions 476.7 421.3 134.9 215.4 283.3 283.3Deferred tax liabilities 66.6 104.0 181.6 149.1 148.8 160.8Non-current provisions 1.4 1.9 3.1 5.1 7.9 7.9Total non-current liabilities 1,106.0 676.9 442.5 555.4 538.3 550.3Current liabilitiesFinancial current liabilities 3 731.7 623.9 309.1 359.9 468.2 190.1Tax liabilities 27.9 29.5 111.3 103.3 78.9 78.9Current provisions 700.6 665.0 558.9 486.7 448.5 448.5Gross amount due to customers for contract work 1,835.3 1,887.1 1,879.2 1,641.0 1,511.8 1,557.9Trade and other payables 3,620.1 3,203.8 3,014.4 3,029.5 3,196.6 3,043.0Total current liabilities 6,915.7 6,409.2 5,872.9 5,620.4 5,704.0 5,318.5TOTAL EQUITY AND LIABILITIES 10,275.4 9,282.3 8,622.2 8,134.1 7,937.6 7,627.7<strong>of</strong> which interest-bearing 1,761.3 1,186.6 547.1 745.7 817.6 539.61 <strong>of</strong> which shares 5.8 4.3 4.5 5.3 5.8 5.82 Current-asset propertiesCommercial Property Development 1,639.8 1,241.0 1,109.5 1,247.0 1,095.8 990.0Residential Development 1,324.1 1,384.4 1,154.6 983.5 1,090.9 706.6Central 169.2Total 3,133.1 2,625.4 2,264.1 2,230.5 2,186.7 1,696.63 Items related to non-interest-bearing unrealized changesin value <strong>of</strong> derivatives/securities are included in thefollowing amounts:Financial non-current assets 1.0Financial current assets 21.9 25.8 22.4 21.4 25.2 25.2Financial non-current liabilities 5.7 0.2Financial current liabilities 10.2 15.4 25.2 22.5 41.9 41.9<strong>Skanska</strong> Annual <strong>Review</strong> <strong>2012</strong> – <strong>EUR</strong> version Notes, including accounting and valuation principles 163


