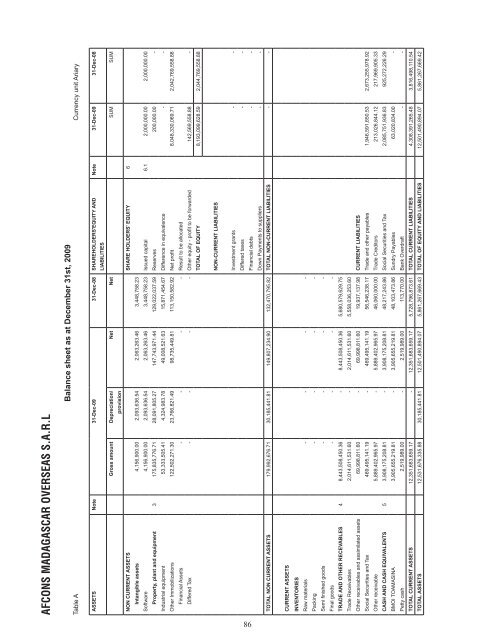
AFCONS MADAGASCAR OVERSEAS S.A.R.LBalance sheet as at December 31st, 2009Table A Currency unit AriaryASSETS Note 31-Dec-09 31-Dec-08 SHAREHOLDERS'EQUITY ANDLIABILITIESNote 31-Dec-09 31-Dec-08Gross amount Depreciation/Net Net SUM SUMprovisionNON CURRENT ASSETS SHARE HOLDERS' EQUITY 6Intangible assets 4,156,900.00 2,093,636.54 2,063,263.46 3,448,758.23Software 4,156,900.00 2,093,636.54 2,063,263.46 3,448,758.23 Issued capital 6.1 2,000,000.00 2,000,000.00Property, plant and equipment 3 175,835,776.71 28,091,805.27 147,743,971.44 129,022,037.59 Reserves 200,000.00 -Industrial equipment 53,333,505.41 4,324,983.78 49,008,521.63 15,871,454.67 Difference in equivalence - -Other Immobilizations 122,502,271.30 23,766,821.49 98,735,449.81 113,150,582.92 Net profit 8,048,330,069.71 2,042,769,558.88Financial Assets - - - - Result to be allocatedDiffered Tax - - - - Other equity - profit to be forwarded 142,569,558.88 -TOTAL OF EQUITY 8,193,099,628.59 2,044,769,558.88NON-CURRENT LIABILITIESInvestment grants - -Differed taxes - -Financial debts - -Down Payments to suppliers - -TOTAL NON CURRENT ASSETS 179,992,676.71 30,185,441.81 149,807,234.90 132,470,795.82 TOTAL NON-CURRENT LIABILITIES - -CURRENT ASSETSINVENTORIESRaw materials - - - -Packing - - - -Semi finished goods - - - -Final goods - - - -TRADE AND OTHER RECEVABLES 4 8,443,508,450.36 - 8,443,508,450.36 5,680,579,629.75Trade Receivables 2,014,611,531.60 - 2,014,611,531.60 5,558,036,253.60Other receivables and assimilated assets 69,998,811.60 - 69,998,811.60 19,937,137.98 CURRENT LIABILITIESSocial Securities and Tax 469,495,141.19 - 469,495,141.19 56,546,238.17 Trade and other payables 1,946,591,650.53 2,673,255,978.92Other receivable 5,889,402,965.97 - 5,889,402,965.97 46,060,000.00 Trade Creditors 213,026,844.12 217,969,905.33CASH AND CASH EQUIVALENTS 5 3,908,175,208.81 - 3,908,175,208.81 48,217,243.86 Social Securities and Tax 2,085,751,936.83 925,272,226.29BMOI TOAMASINA 3,905,655,219.81 - 3,905,655,219.81 48,103,473.86 Sundry Payables 63,020,834.00 -Petty cash 2,519,989.00 - 2,519,989.00 113,770.00 Bank Overdraft - -TOTAL CURRENT ASSETS 12,351,683,659.17 - 12,351,683,659.17 5,728,796,873.61 TOTAL CURRENT LIABILITIES 4,308,391,265.48 3,816,498,110.54TOTAL ASSETS 12,531,676,335.88 30,185,441.81 12,501,490,894.07 5,861,267,669.43 TOTAL OF EQUITY AND LIABILITIES 12,501,490,894.07 5,861,267,669.4286
AFCONS MADAGASCAR OVERSEAS S.A.R.LPROFIT AND LOSS ACCOUNT (by nature)Table BCurrency unit: AriaryPeriod of: December 31 st , 2009 Note 31-Dec-09 31-Dec-08MGAMGATurnover 8 21,022,472,122.85 9,487,459,848.16I. PRODUCTION OF THE PERIOD 21,022,472,122.85 9,487,459,848.16. Purchases 9 3,258,577,069.58 2,315,403,839.83. External Charges 10 4,616,829,449.41 2,649,909,177.46II. COST OF SALES 7,875,406,518.99 4,965,313,017.29III. GROSS OPERATING PROFIT (I - II) 13,147,065,603.86 4,522,146,830.87Salary and wages 11 4,277,946,336.11 2,143,762,936.34Taxes & contributions 12 29,707,447.87 130,000.00IV. GROSS PROFIT 8,839,411,819.88 2,378,253,894.53. Other operating incomes 7,107,283.64 1,174,303.01. Other operating charges 13 156,613,904.01 226,166,423.30. Amortization, Provision and losses in value 85,077,677.32 9,197,538.50. Recovery - -V. OPERATING PROFITS 8,604,827,522.19 2,144,064,235.74. Financial incomes 14 892,864,128.37 283,023,330.71. Financial costs 15 533,526,440.85 156,980,207.57VI. FINANCIAL RESULT 359,337,687.52 126,043,123.14VII. PROFIT BEFORE INCOME TAXES (V + VI) 8,964,165,209.71 2,270,107,358.88. Current Tax 16 915,835,140.00 227,337,800.00. Differed Tax - -TOTAL INCOME FROM CONTINUING OPERATIONS 21,922,443,534.86 9,771,657,481.88TOTAL EXPENSES FROM CONTINUING OPERATIONS 13,874,113,465.15 7,728,887,923.00VIII. NET PROFIT FOR THE YEAR FROM CONTINUING OPERATIONS 8,048,330,069.71 2,042,769,558.88. Discountinued operations income (products) - -. Discountinued operations Costs (expenses) - -IX. DISCOUNTINUED OPERATION RESULT - -X. NET PROFIT FOR THE FINANCIAL YEAR 8,048,330,069.71 2,042,769,558.88CASHFLOW STATEMENT ON December 31 st , 2009 (INDIRECT METHOD)Table CCurrency unit: AriaryNote 31-Dec-09 31-Dec-08Cash flows from operating activitiesNet profit for the year 8,048,330,069.71 2,042,769,558.88Adjustments for:- Depreciation 85,077,677.32 9,197,538.50- Trade and Other Receivables Variations 3,073,294,013.70 (5,699,655,698.35)- Trade and other Payables Variations (731,607,389.60) 2,891,225,884.25- debts towards the State and social organisms Variations 1,160,479,710.54 925,272,226.29- Assets disposal profit/loss 2,090,976.67 -Net cash generated from operating activities (A) 11,637,665,058.34 168,809,509.56Cash flows from investing activitiesPurchases of property, plant and equipment 3 (42,091,342.41) (122,592,265.70)Fixed assets adjustment 607,083.33 -Net cash used in investing activities (B) (41,484,259.08) (122,592,265.70)Cash flows from financing activitiesDividends paid to the shareholders (2008 INCOME) (1,900,000,000.00) -Dividends paid to the shareholders (2009 INCOME) (5,836,222,834.31) -Proceeds from issuance of ordinary shares - 2,000,000.00Net cash used in financing activities (C) (7,736,222,834.31) 2,000,000.00Net (decrease)/increase in cash, cash equivalents and bank overdrafts (A+B+C) 3,859,957,964.95 48,217,243.86Cash, cash equivalents and bank overdrafts at beginning of year (48,217,243.86) -Cash, cash equivalents and bank overdrafts at end of year 3,908,175,208.81 48,217,243.86Exchange gains/(losses) on cash and bank overdrafts - -Variation of treasury 3,859,957,964.95 48,217,243.8687