Study of Hygienic practices of street food vendors in ... - Shiats.edu.in
Study of Hygienic practices of street food vendors in ... - Shiats.edu.in
Study of Hygienic practices of street food vendors in ... - Shiats.edu.in

You also want an ePaper? Increase the reach of your titles
YUMPU automatically turns print PDFs into web optimized ePapers that Google loves.
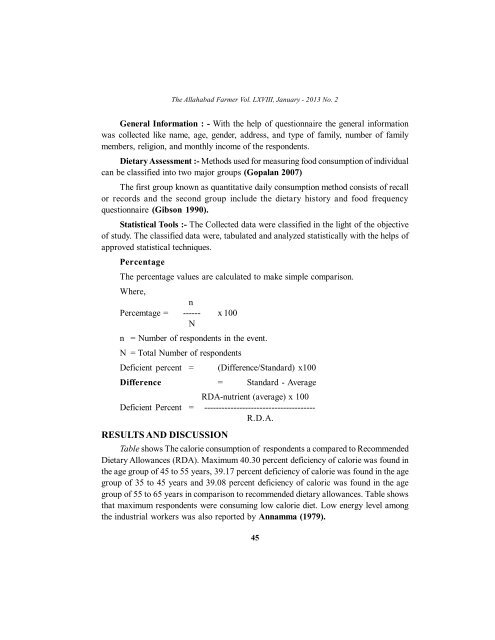
The Allahabad Farmer Vol. LXVIII, January - 2013 No. 2General Information : - With the help <strong>of</strong> questionnaire the general <strong>in</strong>formationwas collected like name, age, gender, address, and type <strong>of</strong> family, number <strong>of</strong> familymembers, religion, and monthly <strong>in</strong>come <strong>of</strong> the respondents.Dietary Assessment :- Methods used for measur<strong>in</strong>g <strong>food</strong> consumption <strong>of</strong> <strong>in</strong>dividualcan be classified <strong>in</strong>to two major groups (Gopalan 2007)The first group known as quantitative daily consumption method consists <strong>of</strong> recallor records and the second group <strong>in</strong>clude the dietary history and <strong>food</strong> frequencyquestionnaire (Gibson 1990).Statistical Tools :- The Collected data were classified <strong>in</strong> the light <strong>of</strong> the objective<strong>of</strong> study. The classified data were, tabulated and analyzed statistically with the helps <strong>of</strong>approved statistical techniques.PercentageThe percentage values are calculated to make simple comparison.Where,nPercemtage = ------ x 100Nn = Number <strong>of</strong> respondents <strong>in</strong> the event.N = Total Number <strong>of</strong> respondentsDeficient percent = (Difference/Standard) x100Difference = Standard - AverageRDA-nutrient (average) x 100Deficient Percent = --------------------------------------R.D.A.RESULTS AND DISCUSSIONTable shows The calorie consumption <strong>of</strong> respondents a compared to RecommendedDietary Allowances (RDA). Maximum 40.30 percent deficiency <strong>of</strong> calorie was found <strong>in</strong>the age group <strong>of</strong> 45 to 55 years, 39.17 percent deficiency <strong>of</strong> calorie was found <strong>in</strong> the agegroup <strong>of</strong> 35 to 45 years and 39.08 percent deficiency <strong>of</strong> caloric was found <strong>in</strong> the agegroup <strong>of</strong> 55 to 65 years <strong>in</strong> comparison to recommended dietary allowances. Table showsthat maximum respondents were consum<strong>in</strong>g low calorie diet. Low energy level amongthe <strong>in</strong>dustrial workers was also reported by Annamma (1979).45