Study of Hygienic practices of street food vendors in ... - Shiats.edu.in
Study of Hygienic practices of street food vendors in ... - Shiats.edu.in
Study of Hygienic practices of street food vendors in ... - Shiats.edu.in

You also want an ePaper? Increase the reach of your titles
YUMPU automatically turns print PDFs into web optimized ePapers that Google loves.
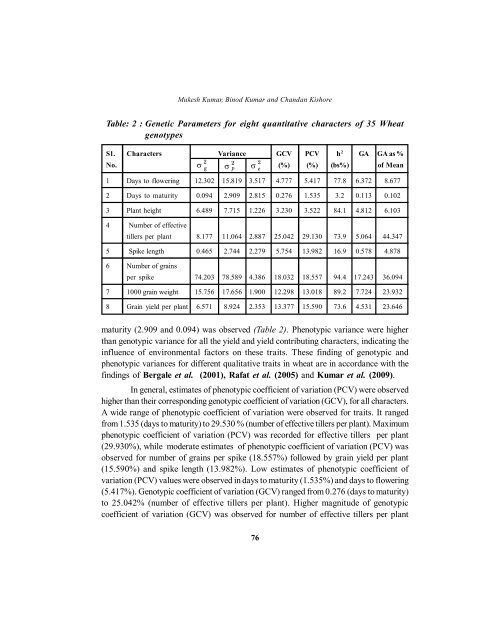
Mukesh Kumar, B<strong>in</strong>od Kumar and Chandan KishoreTable: 2 : Genetic Parameters for eight quantitative characters <strong>of</strong> 35 WheatgenotypesSl. Characters Variance GCV PCV h 2 GA GA as %No.22 2g P e(%) (%) (bs%) <strong>of</strong> Mean1 Days to flower<strong>in</strong>g 12.302 15.819 3.517 4.777 5.417 77.8 6.372 8.6772 Days to maturity 0.094 2.909 2.815 0.276 1.535 3.2 0.113 0.1023 Plant height 6.489 7.715 1.226 3.230 3.522 84.1 4.812 6.1034 Number <strong>of</strong> effectivetillers per plant 8.177 11.064 2.887 25.042 29.130 73.9 5.064 44.3475 Spike length 0.465 2.744 2.279 5.754 13.982 16.9 0.578 4.8786 Number <strong>of</strong> gra<strong>in</strong>sper spike 74.203 78.589 4.386 18.032 18.557 94.4 17.243 36.0947 1000 gra<strong>in</strong> weight 15.756 17.656 1.900 12.298 13.018 89.2 7.724 23.9328 Gra<strong>in</strong> yield per plant 6.571 8.924 2.353 13.377 15.590 73.6 4.531 23.646maturity (2.909 and 0.094) was observed (Table 2). Phenotypic variance were higherthan genotypic variance for all the yield and yield contribut<strong>in</strong>g characters, <strong>in</strong>dicat<strong>in</strong>g the<strong>in</strong>fluence <strong>of</strong> environmental factors on these traits. These f<strong>in</strong>d<strong>in</strong>g <strong>of</strong> genotypic andphenotypic variances for different qualitative traits <strong>in</strong> wheat are <strong>in</strong> accordance with thef<strong>in</strong>d<strong>in</strong>gs <strong>of</strong> Bergale et al. (2001), Rafat et al. (2005) and Kumar et al. (2009).In general, estimates <strong>of</strong> phenotypic coefficient <strong>of</strong> variation (PCV) were observedhigher than their correspond<strong>in</strong>g genotypic coefficient <strong>of</strong> variation (GCV), for all characters.A wide range <strong>of</strong> phenotypic coefficient <strong>of</strong> variation were observed for traits. It rangedfrom 1.535 (days to maturity) to 29.530 % (number <strong>of</strong> effective tillers per plant). Maximumphenotypic coefficient <strong>of</strong> variation (PCV) was recorded for effective tillers per plant(29.930%), while moderate estimates <strong>of</strong> phenotypic coefficient <strong>of</strong> variation (PCV) wasobserved for number <strong>of</strong> gra<strong>in</strong>s per spike (18.557%) followed by gra<strong>in</strong> yield per plant(15.590%) and spike length (13.982%). Low estimates <strong>of</strong> phenotypic coefficient <strong>of</strong>variation (PCV) values were observed <strong>in</strong> days to maturity (1.535%) and days to flower<strong>in</strong>g(5.417%). Genotypic coefficient <strong>of</strong> variation (GCV) ranged from 0.276 (days to maturity)to 25.042% (number <strong>of</strong> effective tillers per plant). Higher magnitude <strong>of</strong> genotypiccoefficient <strong>of</strong> variation (GCV) was observed for number <strong>of</strong> effective tillers per plant76