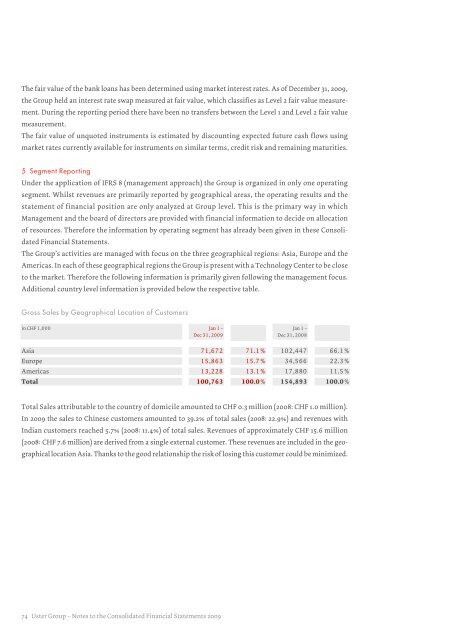
The fair value of the bank loans has been determined using market interest rates. As of December 31, <strong>2009</strong>,the Group held an interest rate swap measured at fair value, which classifies as Level 2 fair value measurement.During the reporting period there have been no transfers between the Level 1 and Level 2 fair valuemeasurement.The fair value of unquoted instruments is estimated by discounting expected future cash flows usingmarket rates currently available for instruments on similar terms, credit risk and remaining maturities.5 Segment <strong>Report</strong>ingUnder the application of IFRS 8 (management approach) the Group is organized in only one operatingsegment. Whilst revenues are primarily reported by geographical areas, the operating results and thestatement of financial position are only analyzed at Group level. This is the primary way in whichManagement and the board of directors are provided with financial information to decide on allocationof resources. Therefore the information by operating segment has already been given in these ConsolidatedFinancial Statements.The Group’s activities are managed with focus on the three geographical regions: Asia, Europe and theAmericas. In each of these geographical regions the Group is present with a Technology Center to be closeto the market. Therefore the following information is primarily given following the management focus.Additional country level information is provided below the respective table.Gross Sales by Geographical Location of Customersin CHF 1,000 Jan 1 –Dec 31, <strong>2009</strong>Jan 1 –Dec 31, 2008Asia 71,672 71.1% 102,447 66.1%Europe 15,863 15.7% 34,566 22.3%Americas 13,228 13.1% 17,880 11.5%Total 100,763 100.0% 154,893 100.0%Total Sales attributable to the country of domicile amounted to CHF 0.3 million (2008: CHF 1.0 million).In <strong>2009</strong> the sales to Chinese customers amounted to 39.2% of total sales (2008: 22.9%) and revenues withIndian customers reached 5.7% (2008: 11.4%) of total sales. Revenues of approximately CHF 15.6 million(2008: CHF 7.6 million) are derived from a single external customer. These revenues are included in the geographicallocation Asia. Thanks to the good relationship the risk of losing this customer could be minimized.74 <strong>Uster</strong> Group – Notes to the Consolidated Financial Statements <strong>2009</strong>
Gross Sales by Testing Instrumentation and ServiceGross sales primarily derive from the sale of testing instrumentation which is used to increase and balancethe quality of textile production and from service sales consisting of the maintenance of these instruments.in CHF 1,000 Dec 31, <strong>2009</strong> Dec 31, 2008Testing instrumentation 85,232 84.6% 136,301 88.0%Service sales 15,531 15.4% 18,592 12.0%Total 100,763 100.0% 154,893 100.0%Non-current Assets 1) by Geographical Location of Legal Entityin CHF 1,000 Dec 31, <strong>2009</strong> Dec 31, 2008Asia 3,216 0.9% 3,506 1.0%Europe 337,482 98.3% 350,687 98.2%Americas 2,751 0.8% 3,078 0.9%Total 343,449 100.0% 357,271 100.0%1)Other than financial instruments, deferred tax assets and post-employment benefit assets.The full amount of non-current assets in Europe is attributable to the country of domicile.6 Sales DeductionsSales deductions include items that are directly related to revenue from sales such as discounts, currencydifferences, shipping expenses and the change in the allowance for uncollectible receivables (see note 18Receivables Trade).7 Cost of Goods SoldCost of goods sold comprises direct production costs such as material expense and personnel costs as well asa proportion of overhead costs like logistics procurement and quality control. The material expense for <strong>2009</strong>amounted to CHF -24.9 million (2008: CHF -39.4 million).Additionally warranty costs and the depreciation on the production equipment are included in this expensecategory.8 Overhead8.1 Sales and Marketing ExpensesThis position contains expenses for sales and marketing activities such as wages, amortization, depreciation,project cost, agent commissions, consultancy, and other overhead costs.8.2 Research and Development ExpensesThe expenditure for research and development includes wages, amortization, depreciation, material costs,consultancy, and other overhead costs related to research and development projects.8.3 Management and Administrative ExpensesManagement and administrative expenses consist of wages, amortization, depreciation, rent, consultancy,IT, and other overhead costs of the support process.<strong>Uster</strong> Group – Notes to the Consolidated Financial Statements <strong>2009</strong> 75
- Page 1 and 2:
Uster Technologies Ltd | Annual Rep
- Page 3 and 4:
Achievements 2009• EBITA margin m
- Page 5:
PortraitThe Uster Group is the lead
- Page 8 and 9:
Table of ContentsInhaltsverzeichnis
- Page 10 and 11:
Max-Ulrich Zellweger, Geoffrey Scot
- Page 12 and 13:
Quality means the customercomes bac
- Page 14 and 15:
Operational ReviewOperativer Rückb
- Page 16 and 17:
Inconsistent quality meansloss of p
- Page 18 and 19:
position as the world leader and au
- Page 20 and 21:
Poor quality can destroybrand reput
- Page 22 and 23:
Sales and MarketingVertrieb und Mar
- Page 24 and 25:
The hidden cost of poor qualityThin
- Page 26 and 27:
Research and InnovationForschung un
- Page 28 and 29:
OperationsProduktion und LogistikIn
- Page 30 and 31: OutlookAusblickSeveral trends and l
- Page 32 and 33: Corporate GovernanceThe information
- Page 34 and 35: • On February 10, 2009, Lombard O
- Page 36 and 37: 2.4 Shares and Participation Certif
- Page 38 and 39: Board of DirectorsMembers of the Bo
- Page 40 and 41: Harald Rönn, Member of the Board o
- Page 42 and 43: The Board of Directors may entrust
- Page 44 and 45: Nomination and Compensation Committ
- Page 46 and 47: Executive CommitteeMembers of the E
- Page 48 and 49: 4 Executive Committee4.1 Members of
- Page 50 and 51: Harold R. Hoke Jr., Head of Sales a
- Page 52 and 53: 6.2 Statutory QuorumsUnless mandato
- Page 54 and 55: 9 Information PolicyUster Technolog
- Page 56 and 57: Comment on the Consolidated Financi
- Page 58 and 59: Uster Group - Consolidated Financia
- Page 60 and 61: Consolidated Statement of Cash Flow
- Page 62 and 63: Consolidated Statement of Changes i
- Page 64 and 65: 2.5 Impairment of Goodwill and Inta
- Page 66 and 67: Standards, Amendments and Interpret
- Page 68 and 69: 3.4 Intangible AssetsBusiness Combi
- Page 70 and 71: 3.6 Financial InstrumentsFinancial
- Page 72 and 73: 3.7 InventoriesInventories are meas
- Page 74 and 75: 3.13 Revenue RecognitionRevenue fro
- Page 76 and 77: The carrying amount of financial as
- Page 78 and 79: The table below sets out the carryi
- Page 82 and 83: 8.4 Personnel Expensein CHF 1,000 J
- Page 84 and 85: 12 Intangible Assetsin CHF 1,000 Cu
- Page 86 and 87: 13 Impairment Testing of Goodwill a
- Page 88 and 89: 14 Property, Plant and Equipmentin
- Page 90 and 91: The changes in the present value of
- Page 92 and 93: 16 Income TaxStatement of Comprehen
- Page 94 and 95: Movements in Temporary DifferencesT
- Page 96 and 97: The ageing of these receivables is
- Page 98 and 99: 21.3 DividendsThe holders of regist
- Page 100 and 101: Restructuring ProvisionsThe Company
- Page 102 and 103: 26 Operating Lease CommitmentsNon-c
- Page 104 and 105: Report of the Statutory Auditor on
- Page 106 and 107: Uster Technologies Ltd - Financial
- Page 108 and 109: Uster Technologies Ltd - Notes to t
- Page 110 and 111: 10 Investments in SubsidiariesAs of
- Page 112 and 113: Executive Committeein CHF 2008Name
- Page 114 and 115: Report of the Statutory Auditor on
- Page 116 and 117: Information for InvestorsShare Info
- Page 118 and 119: Key Figuresin CHF 1,000 Jan 1 -Dec
- Page 120 and 121: in CHF 1,000 2009 2008 2007 2006 1)
- Page 122: ImprintContent Concept and EditingI


