Uster Technologies Ltd | Annual Report 2009 Uster Technologies ...
Uster Technologies Ltd | Annual Report 2009 Uster Technologies ...
Uster Technologies Ltd | Annual Report 2009 Uster Technologies ...

You also want an ePaper? Increase the reach of your titles
YUMPU automatically turns print PDFs into web optimized ePapers that Google loves.
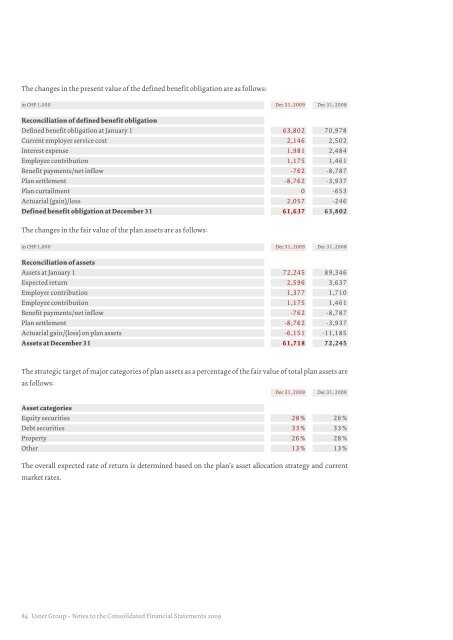
The changes in the present value of the defined benefit obligation are as follows:in CHF 1,000 Dec 31, <strong>2009</strong> Dec 31, 2008Reconciliation of defined benefit obligationDefined benefit obligation at January 1 63,802 70,978Current employer service cost 2,146 2,502Interest expense 1,981 2,484Employee contribution 1,175 1,461Benefit payments / net inflow -762 -8,787Plan settlement -8,762 -3,937Plan curtailment 0 -653Actuarial (gain)/ loss 2,057 -246Defined benefit obligation at December 31 61,637 63,802The changes in the fair value of the plan assets are as follows:in CHF 1,000 Dec 31, <strong>2009</strong> Dec 31, 2008Reconciliation of assetsAssets at January 1 72,245 89,346Expected return 2,596 3,637Employer contribution 1,377 1,710Employee contribution 1,175 1,461Benefit payments / net inflow -762 -8,787Plan settlement -8,762 -3,937Actuarial gain /(loss) on plan assets -6,151 -11,185Assets at December 31 61,718 72,245The strategic target of major categories of plan assets as a percentage of the fair value of total plan assets areas follows:Dec 31, <strong>2009</strong> Dec 31, 2008Asset categoriesEquity securities 28% 26%Debt securities 33% 33%Property 26% 28%Other 13% 13%The overall expected rate of return is determined based on the plan’s asset allocation strategy and currentmarket rates.84 <strong>Uster</strong> Group – Notes to the Consolidated Financial Statements <strong>2009</strong>