8.4 Personnel Expensein CHF 1,000 Jan 1 –Dec 31, <strong>2009</strong>Jan 1 –Dec 31, 2008Wages and salaries 25,470 37,267Social security costs 3,261 4,332Pension costs 2,149 3,637Other personnel expense 767 5,602Total 31,647 50,8388.5 Amortization, Impairment and Depreciationin CHF 1,000 Jan 1 –Dec 31, <strong>2009</strong>Jan 1 –Dec 31, 2008Amortization of technology, customer base, USTER ® STATISTICS 15,066 15,066Amortization of other intangible assets 186 202Depreciation of property, plant and equipment 1,741 1,880Total 16,993 17,1489 Other ExpensesOther expenses amounting to CHF 15.1 million (2008: CHF 15.3 million) consist mainly of the amortizationof technology, customer base, and USTER ® STATISTICS.10 Finance Resultin CHF 1,000 Jan 1 –Dec 31, <strong>2009</strong>Jan 1 –Dec 31, 2008Interest income bank accounts & fixed-term deposits (L&R) 68 262Interest income other receivables (L&R) 61 63Gain on interest rate swap (FLFVTPL) 211 180Exchange gain 269 2,234Finance income 609 2,739Interest expense bank loans (FLAC) -5,826 -7,583Other expenses / fees bank loans (FLAC) -841 -998Loss on interest rate swap (FLFVTPL) 0 -2,073Other finance expense -220 -137Exchange loss -766 -2,159Finance expense -7,653 -12,950Finance result -7,044 -10,211Categories:L&R: Loans and ReceivablesFLFVTPL: Financial Liabilities at Fair Value through Profit or LossFLAC: Financial Liabilities at Amortized Cost76 <strong>Uster</strong> Group – Notes to the Consolidated Financial Statements <strong>2009</strong>
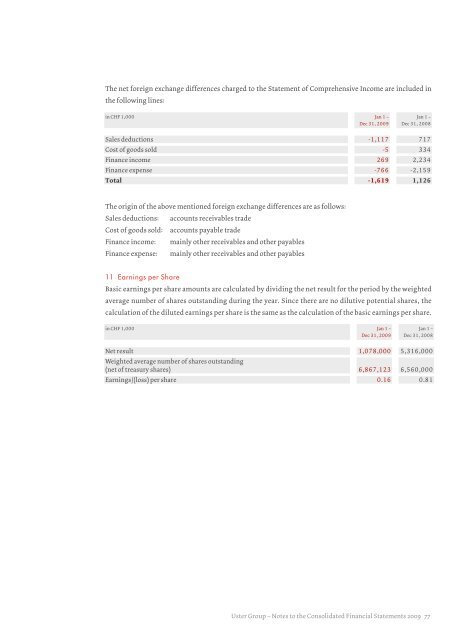
The net foreign exchange differences charged to the Statement of Comprehensive Income are included inthe following lines:in CHF 1,000 Jan 1 –Dec 31, <strong>2009</strong>Jan 1 –Dec 31, 2008Sales deductions -1,117 717Cost of goods sold -5 334Finance income 269 2,234Finance expense -766 -2,159Total -1,619 1,126The origin of the above mentioned foreign exchange differences are as follows:Sales deductions: accounts receivables tradeCost of goods sold: accounts payable tradeFinance income: mainly other receivables and other payablesFinance expense: mainly other receivables and other payables11 Earnings per ShareBasic earnings per share amounts are calculated by dividing the net result for the period by the weightedaverage number of shares outstanding during the year. Since there are no dilutive potential shares, thecalculation of the diluted earnings per share is the same as the calculation of the basic earnings per share.in CHF 1,000 Jan 1 –Dec 31, <strong>2009</strong>Jan 1 –Dec 31, 2008Net result 1,078,000 5,316,000Weighted average number of shares outstanding(net of treasury shares) 6,867,123 6,560,000Earnings /(loss) per share 0.16 0.81<strong>Uster</strong> Group – Notes to the Consolidated Financial Statements <strong>2009</strong> 77
- Page 1 and 2:
Uster Technologies Ltd | Annual Rep
- Page 3 and 4:
Achievements 2009• EBITA margin m
- Page 5:
PortraitThe Uster Group is the lead
- Page 8 and 9:
Table of ContentsInhaltsverzeichnis
- Page 10 and 11:
Max-Ulrich Zellweger, Geoffrey Scot
- Page 12 and 13:
Quality means the customercomes bac
- Page 14 and 15:
Operational ReviewOperativer Rückb
- Page 16 and 17:
Inconsistent quality meansloss of p
- Page 18 and 19:
position as the world leader and au
- Page 20 and 21:
Poor quality can destroybrand reput
- Page 22 and 23:
Sales and MarketingVertrieb und Mar
- Page 24 and 25:
The hidden cost of poor qualityThin
- Page 26 and 27:
Research and InnovationForschung un
- Page 28 and 29:
OperationsProduktion und LogistikIn
- Page 30 and 31:
OutlookAusblickSeveral trends and l
- Page 32 and 33: Corporate GovernanceThe information
- Page 34 and 35: • On February 10, 2009, Lombard O
- Page 36 and 37: 2.4 Shares and Participation Certif
- Page 38 and 39: Board of DirectorsMembers of the Bo
- Page 40 and 41: Harald Rönn, Member of the Board o
- Page 42 and 43: The Board of Directors may entrust
- Page 44 and 45: Nomination and Compensation Committ
- Page 46 and 47: Executive CommitteeMembers of the E
- Page 48 and 49: 4 Executive Committee4.1 Members of
- Page 50 and 51: Harold R. Hoke Jr., Head of Sales a
- Page 52 and 53: 6.2 Statutory QuorumsUnless mandato
- Page 54 and 55: 9 Information PolicyUster Technolog
- Page 56 and 57: Comment on the Consolidated Financi
- Page 58 and 59: Uster Group - Consolidated Financia
- Page 60 and 61: Consolidated Statement of Cash Flow
- Page 62 and 63: Consolidated Statement of Changes i
- Page 64 and 65: 2.5 Impairment of Goodwill and Inta
- Page 66 and 67: Standards, Amendments and Interpret
- Page 68 and 69: 3.4 Intangible AssetsBusiness Combi
- Page 70 and 71: 3.6 Financial InstrumentsFinancial
- Page 72 and 73: 3.7 InventoriesInventories are meas
- Page 74 and 75: 3.13 Revenue RecognitionRevenue fro
- Page 76 and 77: The carrying amount of financial as
- Page 78 and 79: The table below sets out the carryi
- Page 80 and 81: The fair value of the bank loans ha
- Page 84 and 85: 12 Intangible Assetsin CHF 1,000 Cu
- Page 86 and 87: 13 Impairment Testing of Goodwill a
- Page 88 and 89: 14 Property, Plant and Equipmentin
- Page 90 and 91: The changes in the present value of
- Page 92 and 93: 16 Income TaxStatement of Comprehen
- Page 94 and 95: Movements in Temporary DifferencesT
- Page 96 and 97: The ageing of these receivables is
- Page 98 and 99: 21.3 DividendsThe holders of regist
- Page 100 and 101: Restructuring ProvisionsThe Company
- Page 102 and 103: 26 Operating Lease CommitmentsNon-c
- Page 104 and 105: Report of the Statutory Auditor on
- Page 106 and 107: Uster Technologies Ltd - Financial
- Page 108 and 109: Uster Technologies Ltd - Notes to t
- Page 110 and 111: 10 Investments in SubsidiariesAs of
- Page 112 and 113: Executive Committeein CHF 2008Name
- Page 114 and 115: Report of the Statutory Auditor on
- Page 116 and 117: Information for InvestorsShare Info
- Page 118 and 119: Key Figuresin CHF 1,000 Jan 1 -Dec
- Page 120 and 121: in CHF 1,000 2009 2008 2007 2006 1)
- Page 122: ImprintContent Concept and EditingI