SAF-HOLLAND
SAF-HOLLAND - More.de AG
SAF-HOLLAND - More.de AG
- No tags were found...

You also want an ePaper? Increase the reach of your titles
YUMPU automatically turns print PDFs into web optimized ePapers that Google loves.
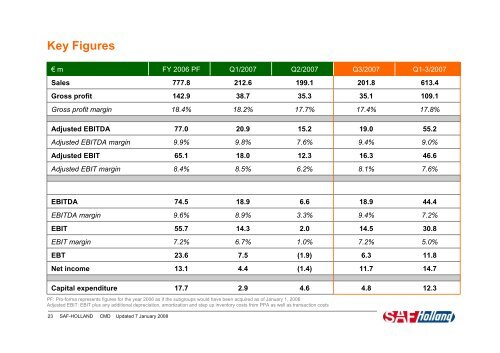
Key Figures<br />
€ m<br />
FY 2006 PF<br />
Q1/2007<br />
Q2/2007<br />
Q3/2007<br />
Q1-3/2007<br />
Sales<br />
777.8<br />
212.6<br />
199.1<br />
201.8<br />
613.4<br />
Gross profit<br />
142.9<br />
38.7<br />
35.3<br />
35.1<br />
109.1<br />
Gross profit margin<br />
18.4%<br />
18.2%<br />
17.7%<br />
17.4%<br />
17.8%<br />
Adjusted EBITDA<br />
77.0<br />
20.9<br />
15.2<br />
19.0<br />
55.2<br />
Adjusted EBITDA margin<br />
9.9%<br />
9.8%<br />
7.6%<br />
9.4%<br />
9.0%<br />
Adjusted EBIT<br />
65.1<br />
18.0<br />
12.3<br />
16.3<br />
46.6<br />
Adjusted EBIT margin<br />
8.4%<br />
8.5%<br />
6.2%<br />
8.1%<br />
7.6%<br />
EBITDA<br />
74.5<br />
18.9<br />
6.6<br />
18.9<br />
44.4<br />
EBITDA margin<br />
9.6%<br />
8.9%<br />
3.3%<br />
9.4%<br />
7.2%<br />
EBIT<br />
55.7<br />
14.3<br />
2.0<br />
14.5<br />
30.8<br />
EBIT margin<br />
7.2%<br />
6.7%<br />
1.0%<br />
7.2%<br />
5.0%<br />
EBT<br />
23.6<br />
7.5<br />
(1.9)<br />
6.3<br />
11.8<br />
Net income<br />
13.1<br />
4.4<br />
(1.4)<br />
11.7<br />
14.7<br />
Capital expenditure<br />
17.7<br />
2.9<br />
4.6<br />
4.8<br />
12.3<br />
PF: Pro-forma represents figures for the year 2006 as if the subgroups would have been acquired as of January 1, 2006<br />
Adjusted EBIT: EBIT plus any additional depreciation, amortization and step up inventory costs from PPA as well as transaction costs<br />
23 <strong>SAF</strong>-<strong>HOLLAND</strong> CMD Updated 7 January 2008