Research Journal of Economics & Business Studies - RJEBS - The ...
Research Journal of Economics & Business Studies - RJEBS - The ...
Research Journal of Economics & Business Studies - RJEBS - The ...
- No tags were found...
Create successful ePaper yourself
Turn your PDF publications into a flip-book with our unique Google optimized e-Paper software.
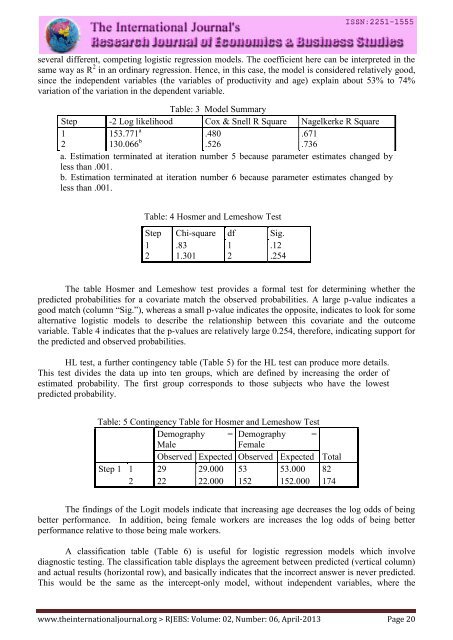
several different, competing logistic regression models. <strong>The</strong> coefficient here can be interpreted in the<br />
same way as R 2 in an ordinary regression. Hence, in this case, the model is considered relatively good,<br />
since the independent variables (the variables <strong>of</strong> productivity and age) explain about 53% to 74%<br />
variation <strong>of</strong> the variation in the dependent variable.<br />
Table: 3 Model Summary<br />
Step -2 Log likelihood Cox & Snell R Square Nagelkerke R Square<br />
1 153.771 a .480 .671<br />
2 130.066 b .526 .736<br />
a. Estimation terminated at iteration number 5 because parameter estimates changed by<br />
less than .001.<br />
b. Estimation terminated at iteration number 6 because parameter estimates changed by<br />
less than .001.<br />
Table: 4 Hosmer and Lemeshow Test<br />
Step Chi-square df Sig.<br />
1 .83 1 .12<br />
2 1.301 2 .254<br />
<strong>The</strong> table Hosmer and Lemeshow test provides a formal test for determining whether the<br />
predicted probabilities for a covariate match the observed probabilities. A large p-value indicates a<br />
good match (column “Sig.”), whereas a small p-value indicates the opposite, indicates to look for some<br />
alternative logistic models to describe the relationship between this covariate and the outcome<br />
variable. Table 4 indicates that the p-values are relatively large 0.254, therefore, indicating support for<br />
the predicted and observed probabilities.<br />
HL test, a further contingency table (Table 5) for the HL test can produce more details.<br />
This test divides the data up into ten groups, which are defined by increasing the order <strong>of</strong><br />
estimated probability. <strong>The</strong> first group corresponds to those subjects who have the lowest<br />
predicted probability.<br />
Table: 5 Contingency Table for Hosmer and Lemeshow Test<br />
Demography = Demography =<br />
Male<br />
Female<br />
Observed Expected Observed Expected Total<br />
Step 1 1 29 29.000 53 53.000 82<br />
2 22 22.000 152 152.000 174<br />
<strong>The</strong> findings <strong>of</strong> the Logit models indicate that increasing age decreases the log odds <strong>of</strong> being<br />
better performance. In addition, being female workers are increases the log odds <strong>of</strong> being better<br />
performance relative to those being male workers.<br />
A classification table (Table 6) is useful for logistic regression models which involve<br />
diagnostic testing. <strong>The</strong> classification table displays the agreement between predicted (vertical column)<br />
and actual results (horizontal row), and basically indicates that the incorrect answer is never predicted.<br />
This would be the same as the intercept-only model, without independent variables, where the<br />
www.theinternationaljournal.org > <strong>RJEBS</strong>: Volume: 02, Number: 06, April-2013 Page 20


