

Research Journal of Economics & Business Studies - RJEBS - The ...
Research Journal of Economics & Business Studies - RJEBS - The ...
Research Journal of Economics & Business Studies - RJEBS - The ...
- No tags were found...

You also want an ePaper? Increase the reach of your titles
YUMPU automatically turns print PDFs into web optimized ePapers that Google loves.
Customer Satisfaction<br />
Kotler and Armstrong (2012), report that satisfaction is the post-purchase evaluation <strong>of</strong> products or<br />
services taking into considerations <strong>of</strong> expectation. <strong>Research</strong>ers, academicians and managers are<br />
divided over the antecedents <strong>of</strong> service quality and satisfaction. Whilst some think service quality<br />
leads to satisfaction, others think otherwise (Ting, 2004). <strong>The</strong> studies <strong>of</strong> Lee (2000), Suleman (2011)<br />
and Buttle (1998) suggest service quality leads to satisfaction. As service quality improves, the<br />
probability <strong>of</strong> customer satisfaction increases. According to Suleman (2011), Reliability, Tangible,<br />
Responsiveness and assurance have sufficient and positive effect on customer satisfaction, mean while<br />
empathy was found to have a significant and negative effect.<br />
Importance-Satisfaction Model and zone <strong>of</strong> tolerance<br />
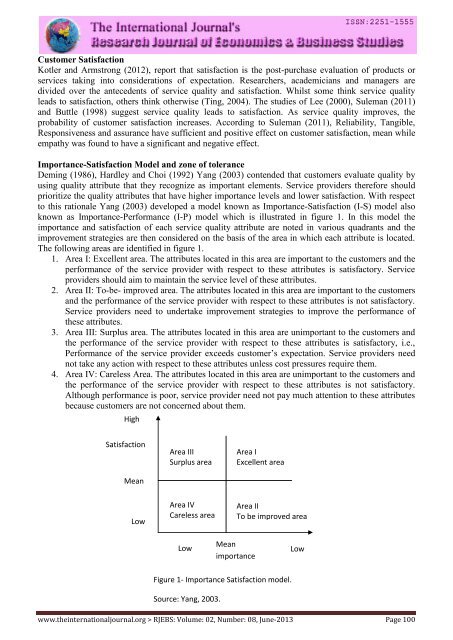
Deming (1986), Hardley and Choi (1992) Yang (2003) contended that customers evaluate quality by<br />
using quality attribute that they recognize as important elements. Service providers therefore should<br />
prioritize the quality attributes that have higher importance levels and lower satisfaction. With respect<br />
to this rationale Yang (2003) developed a model known as Importance-Satisfaction (I-S) model also<br />
known as Importance-Performance (I-P) model which is illustrated in figure 1. In this model the<br />
importance and satisfaction <strong>of</strong> each service quality attribute are noted in various quadrants and the<br />
improvement strategies are then considered on the basis <strong>of</strong> the area in which each attribute is located.<br />
<strong>The</strong> following areas are identified in figure 1.<br />
1. Area I: Excellent area. <strong>The</strong> attributes located in this area are important to the customers and the<br />
performance <strong>of</strong> the service provider with respect to these attributes is satisfactory. Service<br />
providers should aim to maintain the service level <strong>of</strong> these attributes.<br />
2. Area II: To-be- improved area. <strong>The</strong> attributes located in this area are important to the customers<br />
and the performance <strong>of</strong> the service provider with respect to these attributes is not satisfactory.<br />
Service providers need to undertake improvement strategies to improve the performance <strong>of</strong><br />
these attributes.<br />
3. Area III: Surplus area. <strong>The</strong> attributes located in this area are unimportant to the customers and<br />
the performance <strong>of</strong> the service provider with respect to these attributes is satisfactory, i.e.,<br />
erformance <strong>of</strong> the service provider exceeds customer’s expectation. ervice providers need<br />
not take any action with respect to these attributes unless cost pressures require them.<br />
4. Area IV: Careless Area. <strong>The</strong> attributes located in this area are unimportant to the customers and<br />
the performance <strong>of</strong> the service provider with respect to these attributes is not satisfactory.<br />
Although performance is poor, service provider need not pay much attention to these attributes<br />
because customers are not concerned about them.<br />
High<br />
h<br />
Satisfaction<br />
Mean<br />
Area III<br />
Surplus area<br />
Area I<br />
Excellent area<br />
Low<br />
Area IV<br />
Careless area<br />
Area II<br />
To be improved area<br />
Low<br />
Mean<br />
importance<br />
Low<br />
Figure 1- Importance Satisfaction model.<br />
Source: Yang, 2003.<br />
www.theinternationaljournal.org > <strong>RJEBS</strong>: Volume: 02, Number: 08, June-2013 Page 100


