

Research Journal of Economics & Business Studies - RJEBS - The ...
Research Journal of Economics & Business Studies - RJEBS - The ...
Research Journal of Economics & Business Studies - RJEBS - The ...
- No tags were found...

Create successful ePaper yourself
Turn your PDF publications into a flip-book with our unique Google optimized e-Paper software.
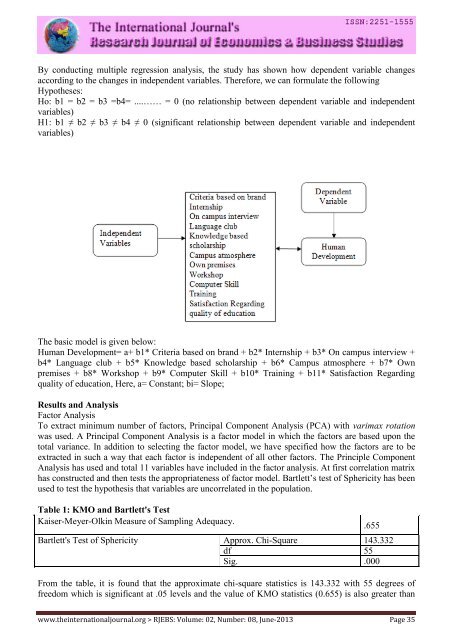
By conducting multiple regression analysis, the study has shown how dependent variable changes<br />
according to the changes in independent variables. <strong>The</strong>refore, we can formulate the following<br />
Hypotheses:<br />
Ho: b1 = b2 = b3 =b4= ....…… = 0 (no relationship between dependent variable and independent<br />
variables)<br />
H1: b1 ≠ b2 ≠ b3 ≠ b4 ≠ 0 (significant relationship between dependent variable and independent<br />
variables)<br />
<strong>The</strong> basic model is given below:<br />
Human Development= a+ b1* Criteria based on brand + b2* Internship + b3* On campus interview +<br />
b4* Language club + b5* Knowledge based scholarship + b6* Campus atmosphere + b7* Own<br />
premises + b8* Workshop + b9* Computer Skill + b10* Training + b11* Satisfaction Regarding<br />
quality <strong>of</strong> education, Here, a= Constant; bi= Slope;<br />
Results and Analysis<br />
Factor Analysis<br />
To extract minimum number <strong>of</strong> factors, Principal Component Analysis (PCA) with varimax rotation<br />
was used. A Principal Component Analysis is a factor model in which the factors are based upon the<br />
total variance. In addition to selecting the factor model, we have specified how the factors are to be<br />
extracted in such a way that each factor is independent <strong>of</strong> all other factors. <strong>The</strong> Principle Component<br />
Analysis has used and total 11 variables have included in the factor analysis. At first correlation matrix<br />
has constructed and then tests the appropriateness <strong>of</strong> factor model. Bartlett’s test <strong>of</strong> Sphericity has been<br />
used to test the hypothesis that variables are uncorrelated in the population.<br />
Table 1: KMO and Bartlett's Test<br />
Kaiser-Meyer-Olkin Measure <strong>of</strong> Sampling Adequacy.<br />
Bartlett's Test <strong>of</strong> Sphericity Approx. Chi-Square 143.332<br />
df 55<br />
Sig. .000<br />
From the table, it is found that the approximate chi-square statistics is 143.332 with 55 degrees <strong>of</strong><br />
freedom which is significant at .05 levels and the value <strong>of</strong> KMO statistics (0.655) is also greater than<br />
.655<br />
www.theinternationaljournal.org > <strong>RJEBS</strong>: Volume: 02, Number: 08, June-2013 Page 35


