

Research Journal of Economics & Business Studies - RJEBS - The ...
Research Journal of Economics & Business Studies - RJEBS - The ...
Research Journal of Economics & Business Studies - RJEBS - The ...
- No tags were found...

You also want an ePaper? Increase the reach of your titles
YUMPU automatically turns print PDFs into web optimized ePapers that Google loves.
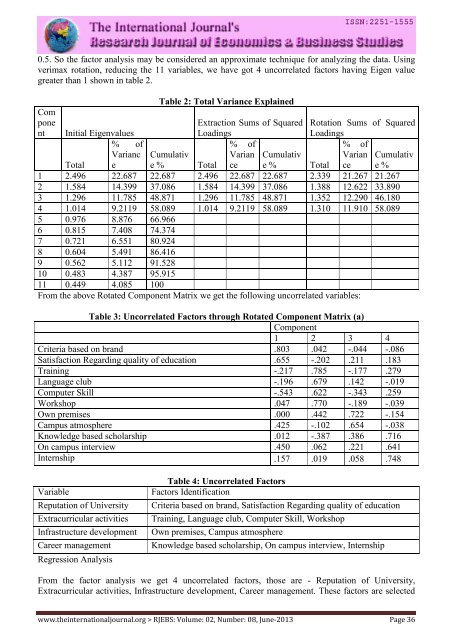
0.5. So the factor analysis may be considered an approximate technique for analyzing the data. Using<br />
verimax rotation, reducing the 11 variables, we have got 4 uncorrelated factors having Eigen value<br />
greater than 1 shown in table 2.<br />
Table 2: Total Variance Explained<br />
Com<br />
pone<br />
nt Initial Eigenvalues<br />
Extraction Sums <strong>of</strong> Squared<br />
Loadings<br />
Rotation Sums <strong>of</strong> Squared<br />
Loadings<br />
% <strong>of</strong><br />
% <strong>of</strong><br />
% <strong>of</strong><br />
Total<br />
Varianc<br />
e<br />
Cumulativ<br />
e % Total<br />
Varian<br />
ce<br />
Cumulativ<br />
e % Total<br />
Varian<br />
ce<br />
Cumulativ<br />
e %<br />
1 2.496 22.687 22.687 2.496 22.687 22.687 2.339 21.267 21.267<br />
2 1.584 14.399 37.086 1.584 14.399 37.086 1.388 12.622 33.890<br />
3 1.296 11.785 48.871 1.296 11.785 48.871 1.352 12.290 46.180<br />
4 1.014 9.2119 58.089 1.014 9.2119 58.089 1.310 11.910 58.089<br />
5 0.976 8.876 66.966<br />
6 0.815 7.408 74.374<br />
7 0.721 6.551 80.924<br />
8 0.604 5.491 86.416<br />
9 0.562 5.112 91.528<br />
10 0.483 4.387 95.915<br />
11 0.449 4.085 100<br />
From the above Rotated Component Matrix we get the following uncorrelated variables:<br />
Table 3: Uncorrelated Factors through Rotated Component Matrix (a)<br />
Component<br />
1 2 3 4<br />
Criteria based on brand .803 .042 -.044 -.086<br />
Satisfaction Regarding quality <strong>of</strong> education .655 -.202 .211 .183<br />
Training -.217 .785 -.177 .279<br />
Language club -.196 .679 .142 -.019<br />
Computer Skill -.543 .622 -.343 .259<br />
Workshop .047 .770 -.189 -.039<br />
Own premises .000 .442 .722 -.154<br />
Campus atmosphere .425 -.102 .654 -.038<br />
Knowledge based scholarship .012 -.387 .386 .716<br />
On campus interview .450 .062 .221 .641<br />
Internship .157 .019 .058 .748<br />
Variable<br />
Reputation <strong>of</strong> University<br />
Extracurricular activities<br />
Infrastructure development<br />
Career management<br />
Regression Analysis<br />
Table 4: Uncorrelated Factors<br />
Factors Identification<br />
Criteria based on brand, Satisfaction Regarding quality <strong>of</strong> education<br />
Training, Language club, Computer Skill, Workshop<br />
Own premises, Campus atmosphere<br />
Knowledge based scholarship, On campus interview, Internship<br />
From the factor analysis we get 4 uncorrelated factors, those are - Reputation <strong>of</strong> University,<br />
Extracurricular activities, Infrastructure development, Career management. <strong>The</strong>se factors are selected<br />
www.theinternationaljournal.org > <strong>RJEBS</strong>: Volume: 02, Number: 08, June-2013 Page 36


