

Research Journal of Economics & Business Studies - RJEBS - The ...
Research Journal of Economics & Business Studies - RJEBS - The ...
Research Journal of Economics & Business Studies - RJEBS - The ...
- No tags were found...

You also want an ePaper? Increase the reach of your titles
YUMPU automatically turns print PDFs into web optimized ePapers that Google loves.
4. RESULTS AND DISCUSSION<br />
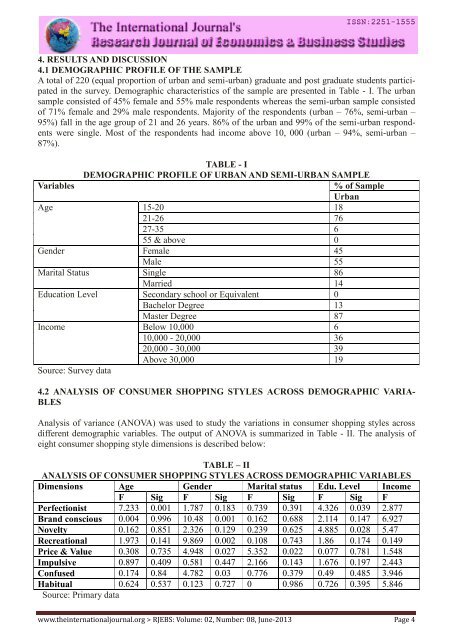
4.1 DEMOGRAPHIC PROFILE OF THE SAMPLE<br />
A total <strong>of</strong> 220 (equal proportion <strong>of</strong> urban and semi-urban) graduate and post graduate students participated<br />
in the survey. Demographic characteristics <strong>of</strong> the sample are presented in Table - I. <strong>The</strong> urban<br />
sample consisted <strong>of</strong> 45% female and 55% male respondents whereas the semi-urban sample consisted<br />
<strong>of</strong> 71% female and 29% male respondents. Majority <strong>of</strong> the respondents (urban – 76%, semi-urban –<br />
95%) fall in the age group <strong>of</strong> 21 and 26 years. 86% <strong>of</strong> the urban and 99% <strong>of</strong> the semi-urban respondents<br />
were single. Most <strong>of</strong> the respondents had income above 10, 000 (urban – 94%, semi-urban –<br />
87%).<br />
Variables<br />
TABLE - I<br />
DEMOGRAPHIC PROFILE OF URBAN AND SEMI-URBAN SAMPLE<br />
Age 15-20 18<br />
21-26 76<br />
27-35 6<br />
55 & above 0<br />
Gender Female 45<br />
Male 55<br />
Marital Status Single 86<br />
Married 14<br />
Education Level Secondary school or Equivalent 0<br />
Bachelor Degree 13<br />
Master Degree 87<br />
Income Below 10,000 6<br />
10,000 - 20,000 36<br />
20,000 - 30,000 39<br />
Above 30,000 19<br />
Source: Survey data<br />
% <strong>of</strong> Sample<br />
Urban<br />
4.2 ANALYSIS OF CONSUMER SHOPPING STYLES ACROSS DEMOGRAPHIC VARIA-<br />
BLES<br />
Analysis <strong>of</strong> variance (ANOVA) was used to study the variations in consumer shopping styles across<br />
different demographic variables. <strong>The</strong> output <strong>of</strong> ANOVA is summarized in Table - II. <strong>The</strong> analysis <strong>of</strong><br />
eight consumer shopping style dimensions is described below:<br />
TABLE – II<br />
ANALYSIS OF CONSUMER SHOPPING STYLES ACROSS DEMOGRAPHIC VARIABLES<br />
Dimensions Age Gender Marital status Edu. Level Income<br />
F Sig F Sig F Sig F Sig F<br />
Perfectionist 7.233 0.001 1.787 0.183 0.739 0.391 4.326 0.039 2.877<br />
Brand conscious 0.004 0.996 10.48 0.001 0.162 0.688 2.114 0.147 6.927<br />
Novelty 0.162 0.851 2.326 0.129 0.239 0.625 4.885 0.028 5.47<br />
Recreational 1.973 0.141 9.869 0.002 0.108 0.743 1.86 0.174 0.149<br />
Price & Value 0.308 0.735 4.948 0.027 5.352 0.022 0.077 0.781 1.548<br />
Impulsive 0.897 0.409 0.581 0.447 2.166 0.143 1.676 0.197 2.443<br />
Confused 0.174 0.84 4.782 0.03 0.776 0.379 0.49 0.485 3.946<br />
Habitual 0.624 0.537 0.123 0.727 0 0.986 0.726 0.395 5.846<br />
Source: Primary data<br />
www.theinternationaljournal.org > <strong>RJEBS</strong>: Volume: 02, Number: 08, June-2013 Page 4


