Research Journal of Economics & Business Studies - RJEBS - The ...
Research Journal of Economics & Business Studies - RJEBS - The ...
Research Journal of Economics & Business Studies - RJEBS - The ...
- No tags were found...
Create successful ePaper yourself
Turn your PDF publications into a flip-book with our unique Google optimized e-Paper software.
2.4 DATA ANALYSIS<br />
<strong>The</strong> collected data were analysed by using a statistical package <strong>of</strong> SPSS 17.0. Scores for each<br />
category were calculated by assigning correct responses. Percentage analysis <strong>of</strong> demographic factor is<br />
calculated and presented in tabular form. F test was used to analyse the satisfaction level on PDS<br />
among different income group <strong>of</strong> respondents at 5% level <strong>of</strong> significance. t test have been used to find<br />
out the relationship between satisfaction level on PDS and residential area and marital status <strong>of</strong> the<br />
respondents. Factor analysis has been used to find out the service qualities <strong>of</strong> PDS. Regression analysis<br />
has been used to find out the service qualities and commodities. Correlation has been used to find out<br />
the availability <strong>of</strong> commodities in PDS.<br />
3. RESULTS AND DISCUSSION<br />
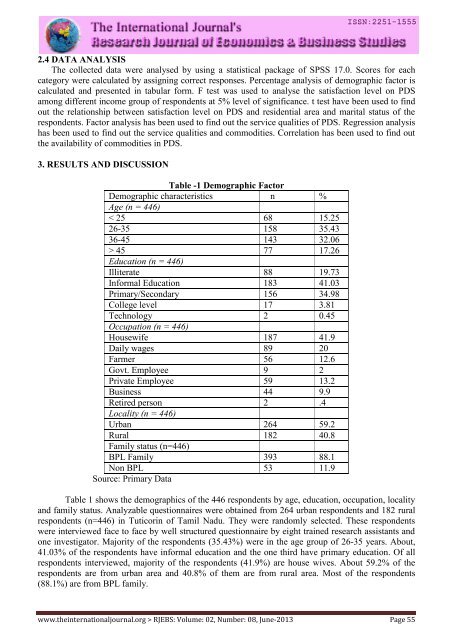
Table -1 Demographic Factor<br />
Demographic characteristics n %<br />
Age (n = 446)<br />
< 25 68 15.25<br />
26-35 158 35.43<br />
36-45 143 32.06<br />
> 45 77 17.26<br />
Education (n = 446)<br />
Illiterate 88 19.73<br />
Informal Education 183 41.03<br />
Primary/Secondary 156 34.98<br />
College level 17 3.81<br />
Technology 2 0.45<br />
Occupation (n = 446)<br />
Housewife 187 41.9<br />
Daily wages 89 20<br />
Farmer 56 12.6<br />
Govt. Employee 9 2<br />
Private Employee 59 13.2<br />
<strong>Business</strong> 44 9.9<br />
Retired person 2 .4<br />
Locality (n = 446)<br />
Urban 264 59.2<br />
Rural 182 40.8<br />
Family status (n=446)<br />
BPL Family 393 88.1<br />
Non BPL 53 11.9<br />
Source: Primary Data<br />
Table 1 shows the demographics <strong>of</strong> the 446 respondents by age, education, occupation, locality<br />
and family status. Analyzable questionnaires were obtained from 264 urban respondents and 182 rural<br />
respondents (n=446) in Tuticorin <strong>of</strong> Tamil Nadu. <strong>The</strong>y were randomly selected. <strong>The</strong>se respondents<br />
were interviewed face to face by well structured questionnaire by eight trained research assistants and<br />
one investigator. Majority <strong>of</strong> the respondents (35.43%) were in the age group <strong>of</strong> 26-35 years. About,<br />
41.03% <strong>of</strong> the respondents have informal education and the one third have primary education. Of all<br />
respondents interviewed, majority <strong>of</strong> the respondents (41.9%) are house wives. About 59.2% <strong>of</strong> the<br />
respondents are from urban area and 40.8% <strong>of</strong> them are from rural area. Most <strong>of</strong> the respondents<br />
(88.1%) are from BPL family.<br />
www.theinternationaljournal.org > <strong>RJEBS</strong>: Volume: 02, Number: 08, June-2013 Page 55


