

Research Journal of Economics & Business Studies - RJEBS - The ...
Research Journal of Economics & Business Studies - RJEBS - The ...
Research Journal of Economics & Business Studies - RJEBS - The ...
- No tags were found...

Create successful ePaper yourself
Turn your PDF publications into a flip-book with our unique Google optimized e-Paper software.
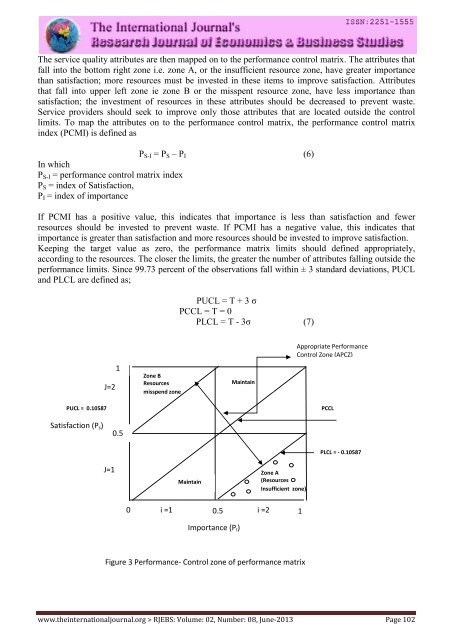
<strong>The</strong> service quality attributes are then mapped on to the performance control matrix. <strong>The</strong> attributes that<br />
fall into the bottom right zone i.e. zone A, or the insufficient resource zone, have greater importance<br />
than satisfaction; more resources must be invested in these items to improve satisfaction. Attributes<br />
that fall into upper left zone ie zone B or the misspent resource zone, have less importance than<br />
satisfaction; the investment <strong>of</strong> resources in these attributes should be decreased to prevent waste.<br />
Service providers should seek to improve only those attributes that are located outside the control<br />
limits. To map the attributes on to the performance control matrix, the performance control matrix<br />
index (PCMI) is defined as<br />
P S-I = P S – P I (6)<br />
In which<br />
P S-I = performance control matrix index<br />
P S = index <strong>of</strong> Satisfaction,<br />
P I = index <strong>of</strong> importance<br />
If PCMI has a positive value, this indicates that importance is less than satisfaction and fewer<br />
resources should be invested to prevent waste. If PCMI has a negative value, this indicates that<br />
importance is greater than satisfaction and more resources should be invested to improve satisfaction.<br />
Keeping the target value as zero, the performance matrix limits should defined appropriately,<br />
according to the resources. <strong>The</strong> closer the limits, the greater the number <strong>of</strong> attributes falling outside the<br />
performance limits. Since 99.73 percent <strong>of</strong> the observations fall within ± 3 standard deviations, PUCL<br />
and PLCL are defined as;<br />
UCL = T + 3 σ<br />
PCCL = T = 0<br />
PLCL = T - 3σ (7)<br />
PUCL = 0.10587<br />
J=2<br />
1<br />
Zone B<br />
Resources<br />
misspend zone<br />
Maintain<br />
Appropriate Performance<br />
Control Zone (APCZ)<br />
PCCL<br />
Satisfaction (P s )<br />
0.5<br />
PLCL = - 0.10587<br />
J=1<br />
Maintain<br />
Zone A<br />
(Resources<br />
Insufficient zone)<br />
0 i =1<br />
0.5 i =2 1<br />
Importance (P I )<br />
Figure 3 Performance- Control zone <strong>of</strong> performance matrix<br />
www.theinternationaljournal.org > <strong>RJEBS</strong>: Volume: 02, Number: 08, June-2013 Page 102


