- Page 2:
Engineering Geology
- Page 6:
Engineering Geology Second Edition
- Page 10:
Preface As noted in the Preface to
- Page 14:
Contents 1. Rock Types and Stratigr
- Page 18:
Contents Field Instrumentation 344
- Page 22:
Chapter 1 Rock Types and Stratigrap
- Page 26:
Chapter 1 several tens of metres bu
- Page 30:
Chapter 1 Figure 1.4 Distribution o
- Page 34:
Chapter 1 Figure 1.5 Lapilli near C
- Page 38:
Chapter 1 Figure 1.7 (a) Ropy or pa
- Page 42:
Chapter 1 Figure 1.8 Columnar joint
- Page 46:
Chapter 1 Figure 1.9 Pegmatite vein
- Page 50:
Chapter 1 Figure 1.10 Thin section
- Page 54:
Chapter 1 Figure 1.11 An old quarry
- Page 58:
Chapter 1 a b Figure 1.13 (a) Gneis
- Page 62:
Chapter 1 and the types of country
- Page 66:
Chapter 1 A variety of minerals suc
- Page 70:
Chapter 1 metasomatic activity is c
- Page 74:
Chapter 1 derived by partial intras
- Page 78:
Chapter 1 character (are they irreg
- Page 82:
Chapter 1 the top. Individual grade
- Page 86:
Chapter 1 Figure 1.20 Thin section
- Page 90:
Chapter 1 Montmorillonite [(Mg,Al)
- Page 94:
Chapter 1 Figure 1.22 Salt teepees
- Page 98:
Chapter 1 The extent and regularity
- Page 102:
Chapter 1 the lowest bed in the upp
- Page 106:
Table 1.1. The geological timescale
- Page 110:
Chapter 1 The principal way in whic
- Page 114:
Chapter 2 Geological Structures The
- Page 118:
Chapter 2 (b) Figure 2.2 (a) Block
- Page 122:
Chapter 2 (b) Figure 2.4 (a) Types
- Page 126:
Chapter 2 Figure 2.6 Chevron fold i
- Page 130:
Chapter 2 direction of extension. T
- Page 134:
Chapter 2 Figure 2.9 Types of fault
- Page 138:
Chapter 2 Figure 2.11 (a) Repetitio
- Page 142:
Chapter 2 side of a fault are of di
- Page 146:
Chapter 2 Figure 2.14 Geometric ori
- Page 150:
Chapter 2 As joints represent surfa
- Page 154:
Chapter 2 (several metres). The int
- Page 158:
Chapter 2 Strength of Discontinuous
- Page 162:
Chapter 2 Table 2.5. Classification
- Page 166:
73 Figure 2.17 Discontinuity survey
- Page 170:
Chapter 2 Figure 2.19 Representatio
- Page 174:
Chapter 3 Surface Processes All lan
- Page 178:
Chapter 3 humid regions more than d
- Page 182:
Chapter 3 Figure 3.3 Honeycomb weat
- Page 186:
Chapter 3 less soluble than limesto
- Page 190:
Chapter 3 Figure 3.4 The slake-dura
- Page 194:
Chapter 3 Because weathering brings
- Page 198:
Chapter 3 Figure 3.6 Approaches to
- Page 202:
Chapter 3 Figure 3.7 Valley bulging
- Page 206:
Chapter 3 Internal slides are usual
- Page 210:
Chapter 3 Figure 3.8 A classificati
- Page 214:
Chapter 3 Figure 3.10 Block diagram
- Page 218:
Chapter 3 direct factor in causing
- Page 222:
Chapter 3 Figure 3.14 (a) Trellised
- Page 226:
Chapter 3 Throughout its length, a
- Page 230:
Chapter 3 Figure 3.17 (a) Paired ri
- Page 234:
Chapter 3 Figure 3.18 Component par
- Page 238:
Chapter 3 In the early stages of ri
- Page 242:
Chapter 3 Karst Topography and Unde
- Page 246:
Chapter 3 Figure 3.22 Appearance of
- Page 250:
Chapter 3 the surface throughout th
- Page 254:
Chapter 3 Figure 3.25 Drumlins, nea
- Page 258:
Chapter 3 barrier, the threshold, o
- Page 262:
Chapter 3 Most melt water streams t
- Page 266:
Chapter 3 Other small ridge-like ka
- Page 270:
Chapter 3 of perennially frozen gro
- Page 274:
Chapter 3 Wind Action Wind erosion
- Page 278:
Chapter 3 Figure 3.32 Buttes and me
- Page 282:
Chapter 3 areas in which there is e
- Page 286:
Chapter 3 commonly falls in both in
- Page 290:
Chapter 3 Figure 3.35 Terminology o
- Page 294:
Chapter 3 disrupts their pattern of
- Page 298:
Chapter 3 is extended out to sea. B
- Page 302:
Chapter 3 (a) (b) Figure 3.37 (Cont
- Page 306:
Chapter 3 Table 3.2. Average beach
- Page 310:
Figure 3.38 Hurst Castle Spit with
- Page 314:
Chapter 3 windspeeds of approximate
- Page 318:
Chapter 3 Free oscillations develop
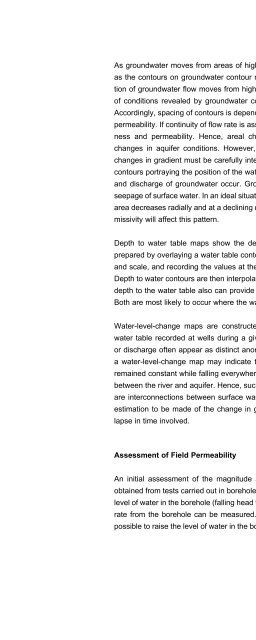
- Page 322: Chapter 4 Groundwater Conditions an
- Page 326: Chapter 4 Figure 4.1 Map of part of
- Page 330: Chapter 4 buried upper surface of a
- Page 334: Chapter 4 Table 4.2. Soil suction p
- Page 338: Chapter 4 The factors affecting the
- Page 342: Chapter 4 Table 4.3. Some examples
- Page 346: Chapter 4 Permeability and porosity
- Page 350: Chapter 4 Flow through Soils and Ro
- Page 354: Chapter 4 General Equation of Flow
- Page 358: Chapter 4 and k h H / k + H / k + H
- Page 362: Chapter 4 Figure 4.8 Standard piezo
- Page 366: Chapter 4 velocity of the upward se
- Page 370: Geological mapping frequently forms
- Page 376: E n g i n e e r i n g G e o l o g y
- Page 380: E n g i n e e r i n g G e o l o g y
- Page 384: E n g i n e e r i n g G e o l o g y
- Page 388: E n g i n e e r i n g G e o l o g y
- Page 392: E n g i n e e r i n g G e o l o g y
- Page 396: E n g i n e e r i n g G e o l o g y
- Page 400: E n g i n e e r i n g G e o l o g y
- Page 404: E n g i n e e r i n g G e o l o g y
- Page 408: E n g i n e e r i n g G e o l o g y
- Page 412: E n g i n e e r i n g G e o l o g y
- Page 416: E n g i n e e r i n g G e o l o g y
- Page 420: E n g i n e e r i n g G e o l o g y
- Page 424:
E n g i n e e r i n g G e o l o g y
- Page 428:
E n g i n e e r i n g G e o l o g y
- Page 432:
E n g i n e e r i n g G e o l o g y
- Page 436:
E n g i n e e r i n g G e o l o g y
- Page 440:
E n g i n e e r i n g G e o l o g y
- Page 444:
E n g i n e e r i n g G e o l o g y
- Page 448:
E n g i n e e r i n g G e o l o g y
- Page 452:
E n g i n e e r i n g G e o l o g y
- Page 456:
E n g i n e e r i n g G e o l o g y
- Page 460:
E n g i n e e r i n g G e o l o g y
- Page 464:
E n g i n e e r i n g G e o l o g y
- Page 468:
E n g i n e e r i n g G e o l o g y
- Page 472:
E n g i n e e r i n g G e o l o g y
- Page 476:
E n g i n e e r i n g G e o l o g y
- Page 480:
E n g i n e e r i n g G e o l o g y
- Page 484:
E n g i n e e r i n g G e o l o g y
- Page 488:
E n g i n e e r i n g G e o l o g y
- Page 492:
E n g i n e e r i n g G e o l o g y
- Page 496:
E n g i n e e r i n g G e o l o g y
- Page 500:
E n g i n e e r i n g G e o l o g y
- Page 504:
E n g i n e e r i n g G e o l o g y
- Page 508:
E n g i n e e r i n g G e o l o g y
- Page 512:
E n g i n e e r i n g G e o l o g y
- Page 516:
248 Table 5.21. Some properties of
- Page 520:
E n g i n e e r i n g G e o l o g y
- Page 524:
252 Table 5.22. Rock type classific
- Page 528:
E n g i n e e r i n g G e o l o g y
- Page 532:
E n g i n e e r i n g G e o l o g y
- Page 536:
E n g i n e e r i n g G e o l o g y
- Page 540:
E n g i n e e r i n g G e o l o g y
- Page 544:
E n g i n e e r i n g G e o l o g y
- Page 548:
E n g i n e e r i n g G e o l o g y
- Page 552:
E n g i n e e r i n g G e o l o g y
- Page 556:
E n g i n e e r i n g G e o l o g y
- Page 560:
E n g i n e e r i n g G e o l o g y
- Page 564:
272 Table 5.33. Some physical prope
- Page 568:
274 Table 5.34. Geomechanical prope
- Page 572:
E n g i n e e r i n g G e o l o g y
- Page 576:
E n g i n e e r i n g G e o l o g y
- Page 580:
280 Table 6.1. Some properties of B
- Page 584:
282 Table 6.2. Some properties of B
- Page 588:
E n g i n e e r i n g G e o l o g y
- Page 592:
E n g i n e e r i n g G e o l o g y
- Page 596:
E n g i n e e r i n g G e o l o g y
- Page 600:
E n g i n e e r i n g G e o l o g y
- Page 604:
E n g i n e e r i n g G e o l o g y
- Page 608:
E n g i n e e r i n g G e o l o g y
- Page 612:
E n g i n e e r i n g G e o l o g y
- Page 616:
E n g i n e e r i n g G e o l o g y
- Page 620:
E n g i n e e r i n g G e o l o g y
- Page 624:
E n g i n e e r i n g G e o l o g y
- Page 628:
E n g i n e e r i n g G e o l o g y
- Page 632:
E n g i n e e r i n g G e o l o g y
- Page 636:
E n g i n e e r i n g G e o l o g y
- Page 640:
This page intentionally left blank
- Page 644:
E n g i n e e r i n g G e o l o g y
- Page 648:
E n g i n e e r i n g G e o l o g y
- Page 652:
E n g i n e e r i n g G e o l o g y
- Page 656:
E n g i n e e r i n g G e o l o g y
- Page 660:
E n g i n e e r i n g G e o l o g y
- Page 664:
E n g i n e e r i n g G e o l o g y
- Page 668:
E n g i n e e r i n g G e o l o g y
- Page 672:
E n g i n e e r i n g G e o l o g y
- Page 676:
E n g i n e e r i n g G e o l o g y
- Page 680:
E n g i n e e r i n g G e o l o g y
- Page 684:
E n g i n e e r i n g G e o l o g y
- Page 688:
E n g i n e e r i n g G e o l o g y
- Page 692:
E n g i n e e r i n g G e o l o g y
- Page 696:
E n g i n e e r i n g G e o l o g y
- Page 700:
E n g i n e e r i n g G e o l o g y
- Page 704:
E n g i n e e r i n g G e o l o g y
- Page 708:
E n g i n e e r i n g G e o l o g y
- Page 712:
E n g i n e e r i n g G e o l o g y
- Page 716:
E n g i n e e r i n g G e o l o g y
- Page 720:
E n g i n e e r i n g G e o l o g y
- Page 724:
E n g i n e e r i n g G e o l o g y
- Page 728:
E n g i n e e r i n g G e o l o g y
- Page 732:
E n g i n e e r i n g G e o l o g y
- Page 736:
E n g i n e e r i n g G e o l o g y
- Page 740:
E n g i n e e r i n g G e o l o g y
- Page 744:
E n g i n e e r i n g G e o l o g y
- Page 748:
E n g i n e e r i n g G e o l o g y
- Page 752:
E n g i n e e r i n g G e o l o g y
- Page 756:
E n g i n e e r i n g G e o l o g y
- Page 760:
E n g i n e e r i n g G e o l o g y
- Page 764:
372 Table 7.7a. Excerpts from the e
- Page 768:
374 Table 7.7b. Key to the engineer
- Page 772:
E n g i n e e r i n g G e o l o g y
- Page 776:
E n g i n e e r i n g G e o l o g y
- Page 780:
E n g i n e e r i n g G e o l o g y
- Page 784:
E n g i n e e r i n g G e o l o g y
- Page 788:
E n g i n e e r i n g G e o l o g y
- Page 792:
E n g i n e e r i n g G e o l o g y
- Page 796:
E n g i n e e r i n g G e o l o g y
- Page 800:
390 Table 8.1. Modified Mercalli Sc
- Page 804:
E n g i n e e r i n g G e o l o g y
- Page 808:
E n g i n e e r i n g G e o l o g y
- Page 812:
E n g i n e e r i n g G e o l o g y
- Page 816:
E n g i n e e r i n g G e o l o g y
- Page 820:
E n g i n e e r i n g G e o l o g y
- Page 824:
E n g i n e e r i n g G e o l o g y
- Page 828:
E n g i n e e r i n g G e o l o g y
- Page 832:
E n g i n e e r i n g G e o l o g y
- Page 836:
E n g i n e e r i n g G e o l o g y
- Page 840:
E n g i n e e r i n g G e o l o g y
- Page 844:
412 Figure 8.15 (a) (b) (a) Rip-rap
- Page 848:
E n g i n e e r i n g G e o l o g y
- Page 852:
E n g i n e e r i n g G e o l o g y
- Page 856:
E n g i n e e r i n g G e o l o g y
- Page 860:
E n g i n e e r i n g G e o l o g y
- Page 864:
E n g i n e e r i n g G e o l o g y
- Page 868:
E n g i n e e r i n g G e o l o g y
- Page 872:
E n g i n e e r i n g G e o l o g y
- Page 876:
E n g i n e e r i n g G e o l o g y
- Page 880:
E n g i n e e r i n g G e o l o g y
- Page 884:
E n g i n e e r i n g G e o l o g y
- Page 888:
E n g i n e e r i n g G e o l o g y
- Page 892:
E n g i n e e r i n g G e o l o g y
- Page 896:
E n g i n e e r i n g G e o l o g y
- Page 900:
E n g i n e e r i n g G e o l o g y
- Page 904:
E n g i n e e r i n g G e o l o g y
- Page 908:
E n g i n e e r i n g G e o l o g y
- Page 912:
E n g i n e e r i n g G e o l o g y
- Page 916:
E n g i n e e r i n g G e o l o g y
- Page 920:
E n g i n e e r i n g G e o l o g y
- Page 924:
This page intentionally left blank
- Page 928:
E n g i n e e r i n g G e o l o g y
- Page 932:
E n g i n e e r i n g G e o l o g y
- Page 936:
E n g i n e e r i n g G e o l o g y
- Page 940:
E n g i n e e r i n g G e o l o g y
- Page 944:
E n g i n e e r i n g G e o l o g y
- Page 948:
E n g i n e e r i n g G e o l o g y
- Page 952:
E n g i n e e r i n g G e o l o g y
- Page 956:
E n g i n e e r i n g G e o l o g y
- Page 960:
E n g i n e e r i n g G e o l o g y
- Page 964:
E n g i n e e r i n g G e o l o g y
- Page 968:
E n g i n e e r i n g G e o l o g y
- Page 972:
E n g i n e e r i n g G e o l o g y
- Page 976:
E n g i n e e r i n g G e o l o g y
- Page 980:
E n g i n e e r i n g G e o l o g y
- Page 984:
E n g i n e e r i n g G e o l o g y
- Page 988:
E n g i n e e r i n g G e o l o g y
- Page 992:
E n g i n e e r i n g G e o l o g y
- Page 996:
488 Table 9.4. The rock mass rating
- Page 1000:
490 Table 9.6. Classification of in
- Page 1004:
492 Table 9.6. Classification of in
- Page 1008:
494 Table 9.6. Classification of in
- Page 1012:
E n g i n e e r i n g G e o l o g y
- Page 1016:
E n g i n e e r i n g G e o l o g y
- Page 1020:
E n g i n e e r i n g G e o l o g y
- Page 1024:
E n g i n e e r i n g G e o l o g y
- Page 1028:
E n g i n e e r i n g G e o l o g y
- Page 1032:
E n g i n e e r i n g G e o l o g y
- Page 1036:
E n g i n e e r i n g G e o l o g y
- Page 1040:
E n g i n e e r i n g G e o l o g y
- Page 1044:
E n g i n e e r i n g G e o l o g y
- Page 1048:
E n g i n e e r i n g G e o l o g y
- Page 1052:
E n g i n e e r i n g G e o l o g y
- Page 1056:
E n g i n e e r i n g G e o l o g y
- Page 1060:
E n g i n e e r i n g G e o l o g y
- Page 1064:
E n g i n e e r i n g G e o l o g y
- Page 1068:
E n g i n e e r i n g G e o l o g y
- Page 1072:
E n g i n e e r i n g G e o l o g y
- Page 1076:
E n g i n e e r i n g G e o l o g y
- Page 1080:
E n g i n e e r i n g G e o l o g y
- Page 1084:
532 Table 9.8. Typical compaction c
- Page 1088:
E n g i n e e r i n g G e o l o g y
- Page 1092:
E n g i n e e r i n g G e o l o g y
- Page 1096:
E n g i n e e r i n g G e o l o g y
- Page 1100:
E n g i n e e r i n g G e o l o g y
- Page 1104:
E n g i n e e r i n g G e o l o g y
- Page 1108:
E n g i n e e r i n g G e o l o g y
- Page 1112:
E n g i n e e r i n g G e o l o g y
- Page 1116:
E n g i n e e r i n g G e o l o g y
- Page 1120:
E n g i n e e r i n g G e o l o g y
- Page 1124:
E n g i n e e r i n g G e o l o g y
- Page 1128:
E n g i n e e r i n g G e o l o g y
- Page 1132:
E n g i n e e r i n g G e o l o g y
- Page 1136:
This page intentionally left blank
- Page 1140:
E n g i n e e r i n g G e o l o g y
- Page 1144:
E n g i n e e r i n g G e o l o g y
- Page 1148:
E n g i n e e r i n g G e o l o g y
- Page 1152:
E n g i n e e r i n g G e o l o g y
- Page 1156:
E n g i n e e r i n g G e o l o g y
- Page 1160:
E n g i n e e r i n g G e o l o g y
- Page 1164:
E n g i n e e r i n g G e o l o g y
- Page 1168:
E n g i n e e r i n g G e o l o g y
- Page 1172:
I n d e x coastal protection, 410,
- Page 1176:
I n d e x grout, 526, 548 groutabil
- Page 1180:
I n d e x rebound, 513 recumbent fo
- Page 1184:
This page intentionally left blank