Blurred Borders - International Community Foundation
Blurred Borders - International Community Foundation
Blurred Borders - International Community Foundation

Create successful ePaper yourself
Turn your PDF publications into a flip-book with our unique Google optimized e-Paper software.
Appendix A:<br />
Crossborder Business Associates Survey of Residents of San Diego and<br />
Tijuana: Methodology and Analysis<br />
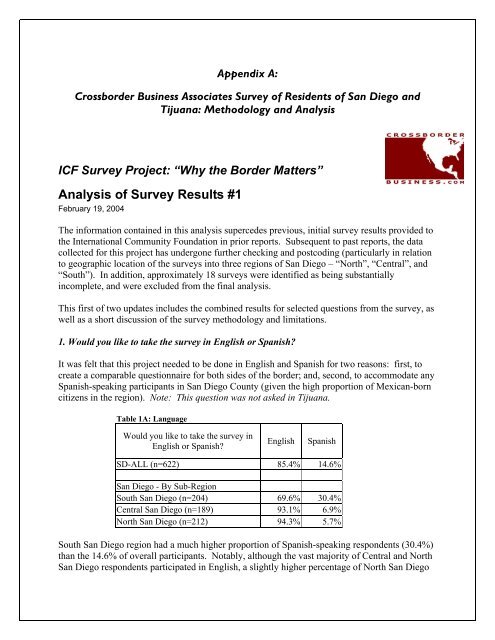
ICF Survey Project: “Why the Border Matters”<br />
Analysis of Survey Results #1<br />
February 19, 2004<br />
The information contained in this analysis supercedes previous, initial survey results provided to<br />
the <strong>International</strong> <strong>Community</strong> <strong>Foundation</strong> in prior reports. Subsequent to past reports, the data<br />
collected for this project has undergone further checking and postcoding (particularly in relation<br />
to geographic location of the surveys into three regions of San Diego – “North”, “Central”, and<br />
“South”). In addition, approximately 18 surveys were identified as being substantially<br />
incomplete, and were excluded from the final analysis.<br />
This first of two updates includes the combined results for selected questions from the survey, as<br />
well as a short discussion of the survey methodology and limitations.<br />
1. Would you like to take the survey in English or Spanish?<br />
It was felt that this project needed to be done in English and Spanish for two reasons: first, to<br />
create a comparable questionnaire for both sides of the border; and, second, to accommodate any<br />
Spanish-speaking participants in San Diego County (given the high proportion of Mexican-born<br />
citizens in the region). Note: This question was not asked in Tijuana.<br />
Table 1A: Language<br />
Would you like to take the survey in<br />
English or Spanish?<br />
English Spanish<br />
SD-ALL (n=622) 85.4% 14.6%<br />
San Diego - By Sub-Region<br />
South San Diego (n=204) 69.6% 30.4%<br />
Central San Diego (n=189) 93.1% 6.9%<br />
North San Diego (n=212) 94.3% 5.7%<br />
South San Diego region had a much higher proportion of Spanish-speaking respondents (30.4%)<br />
than the 14.6% of overall participants. Notably, although the vast majority of Central and North<br />
San Diego respondents participated in English, a slightly higher percentage of North San Diego