Blurred Borders - International Community Foundation
Blurred Borders - International Community Foundation
Blurred Borders - International Community Foundation
You also want an ePaper? Increase the reach of your titles
YUMPU automatically turns print PDFs into web optimized ePapers that Google loves.
participants preferred Spanish than Central San Diego (although<br />
this difference, it should be emphasized, is within the survey’s<br />
margin of error).<br />
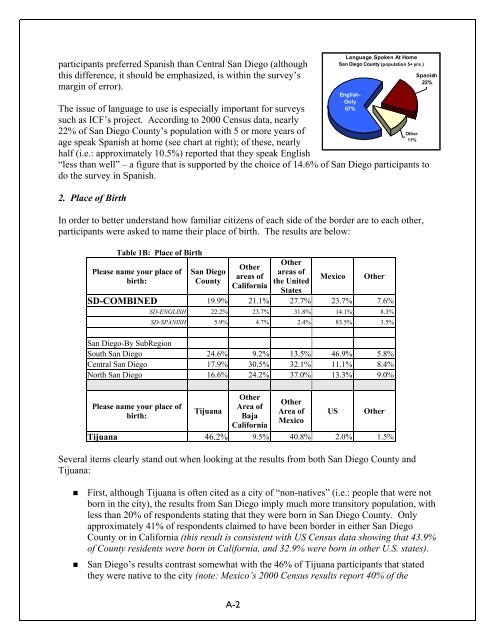
The issue of language to use is especially important for surveys<br />
such as ICF’s project. According to 2000 Census data, nearly<br />
22% of San Diego County’s population with 5 or more years of<br />
age speak Spanish at home (see chart at right); of these, nearly<br />
half (i.e.: approximately 10.5%) reported that they speak English<br />
“less than well” – a figure that is supported by the choice of 14.6% of San Diego participants to<br />
do the survey in Spanish.<br />
2. Place of Birth<br />
In order to better understand how familiar citizens of each side of the border are to each other,<br />
participants were asked to name their place of birth. The results are below:<br />
Table 1B: Place of Birth<br />
Please name your place of<br />
birth:<br />
San Diego<br />
County<br />
Other<br />
areas of<br />
California<br />
A-2<br />
Other<br />
areas of<br />
the United<br />
States<br />
Mexico Other<br />
SD-COMBINED 19.9% 21.1% 27.7% 23.7% 7.6%<br />
SD-ENGLISH 22.2% 23.7% 31.8% 14.1% 8.3%<br />
SD-SPANISH 5.9% 4.7% 2.4% 83.5% 3.5%<br />
San Diego-By SubRegion<br />
South San Diego 24.6% 9.2% 13.5% 46.9% 5.8%<br />
Central San Diego 17.9% 30.5% 32.1% 11.1% 8.4%<br />
North San Diego 16.6% 24.2% 37.0% 13.3% 9.0%<br />
Please name your place of<br />
birth:<br />
Tijuana<br />
Other<br />
Area of<br />
Baja<br />
California<br />
Other<br />
Area of<br />
Mexico<br />
Language Spoken At Home<br />
San Diego County (population 5+ yrs.)<br />
English-<br />
Only<br />
67%<br />
US Other<br />
Tijuana 46.2% 9.5% 40.8% 2.0% 1.5%<br />
Several items clearly stand out when looking at the results from both San Diego County and<br />
Tijuana:<br />
� First, although Tijuana is often cited as a city of “non-natives” (i.e.: people that were not<br />
born in the city), the results from San Diego imply much more transitory population, with<br />
less than 20% of respondents stating that they were born in San Diego County. Only<br />
approximately 41% of respondents claimed to have been border in either San Diego<br />
County or in California (this result is consistent with US Census data showing that 43.9%<br />
of County residents were born in California, and 32.9% were born in other U.S. states).<br />
� San Diego’s results contrast somewhat with the 46% of Tijuana participants that stated<br />
they were native to the city (note: Mexico’s 2000 Census results report 40% of the<br />
Other<br />
11%<br />
Spanish<br />
22%


