Blurred Borders - International Community Foundation
Blurred Borders - International Community Foundation
Blurred Borders - International Community Foundation

Create successful ePaper yourself
Turn your PDF publications into a flip-book with our unique Google optimized e-Paper software.
demographics. For example, among those polled by KPBS/Competitive Edge, only 10% were<br />
Hispanic/Latino and 73% were White, with 17% being of other ethnicities. This is in contrast to<br />
the data from the 2000 US Census for San Diego County, which shows that 26.7% of the<br />
population was of Hispanic/Latino origin, 55% was White (non Latino), and 18.3% was another<br />
ethnicity.<br />
While it would appear that the KPBS/Competitive Edge poll was skewed geographically in favor<br />
of those communities located in San Diego’s North City/North County (53% of those surveyed<br />
lived in this region of the County) the sample set was fairly representative of the geographic<br />
distribution of the county’s population of this area (50%) based on census data. Of those<br />
polled, 27% were from the South City/South County, which roughly corresponds to 33% from<br />
the US Census. 21<br />
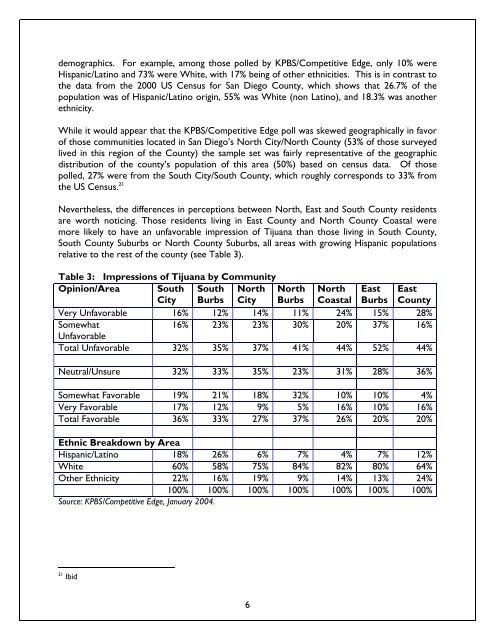
Nevertheless, the differences in perceptions between North, East and South County residents<br />
are worth noticing. Those residents living in East County and North County Coastal were<br />
more likely to have an unfavorable impression of Tijuana than those living in South County,<br />
South County Suburbs or North County Suburbs, all areas with growing Hispanic populations<br />
relative to the rest of the county (see Table 3).<br />
Table 3: Impressions of Tijuana by <strong>Community</strong><br />
Opinion/Area South South North North North East East<br />
City Burbs City Burbs Coastal Burbs County<br />
Very Unfavorable 16% 12% 14% 11% 24% 15% 28%<br />
Somewhat<br />
Unfavorable<br />
16% 23% 23% 30% 20% 37% 16%<br />
Total Unfavorable 32% 35% 37% 41% 44% 52% 44%<br />
Neutral/Unsure 32% 33% 35% 23% 31% 28% 36%<br />
Somewhat Favorable 19% 21% 18% 32% 10% 10% 4%<br />
Very Favorable 17% 12% 9% 5% 16% 10% 16%<br />
Total Favorable 36% 33% 27% 37% 26% 20% 20%<br />
Ethnic Breakdown by Area<br />
Hispanic/Latino 18% 26% 6% 7% 4% 7% 12%<br />
White 60% 58% 75% 84% 82% 80% 64%<br />
Other Ethnicity 22% 16% 19% 9% 14% 13% 24%<br />
100% 100% 100% 100% 100% 100% 100%<br />
Source: KPBS/Competitive Edge, January 2004.<br />
21 Ibid<br />
6