

Annual REPORT
2015-Annual-Report-Financial-Statements
2015-Annual-Report-Financial-Statements

You also want an ePaper? Increase the reach of your titles
YUMPU automatically turns print PDFs into web optimized ePapers that Google loves.
ANNUAL <strong>REPORT</strong> AND FINANCIAL STATEMENTS<br />
FOR THE YEAR ENDED 31 DECEMBER 2015<br />
NOTES TO THE FINANCIAL STATEMENTS (Continued)<br />
4 FINANCIAL RISK MANAGEMENT OBJECTIVES AND POLICIES (Continued)<br />
(b) Liquidity risk (continued)<br />
Liquidity risk based on undiscounted cash flows<br />
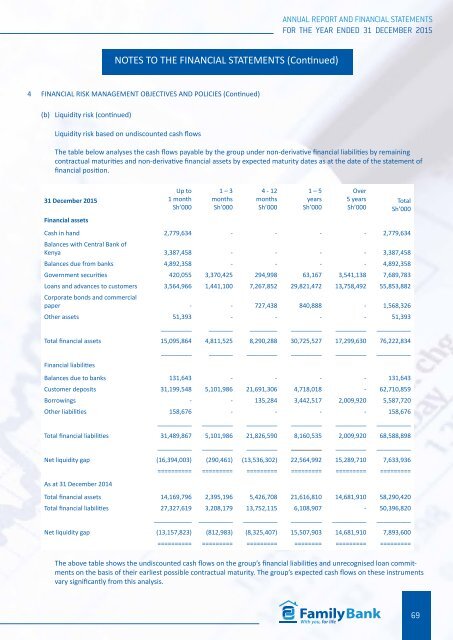
The table below analyses the cash flows payable by the group under non-derivative financial liabilities by remaining<br />
contractual maturities and non-derivative financial assets by expected maturity dates as at the date of the statement of<br />
financial position.<br />
31 December 2015<br />
Financial assets<br />
Up to<br />
1 month<br />
Sh’000<br />
1 – 3<br />
months<br />
Sh’000<br />
4 - 12<br />
months<br />
Sh’000<br />
1 – 5<br />
years<br />
Sh’000<br />
Over<br />
5 years<br />
Sh’000<br />
Total<br />
Sh’000<br />
Cash in hand 2,779,634 - - - - 2,779,634<br />
Balances with Central Bank of<br />
Kenya 3,387,458 - - - - 3,387,458<br />
Balances due from banks 4,892,358 - - - - 4,892,358<br />
Government securities 420,055 3,370,425 294,998 63,167 3,541,138 7,689,783<br />
Loans and advances to customers 3,564,966 1,441,100 7,267,852 29,821,472 13,758,492 55,853,882<br />
Corporate bonds and commercial<br />
paper - - 727,438 840,888 - 1,568,326<br />
Other assets 51,393 - - - - 51,393<br />
_________ _______ ________ _________ _________ __________<br />
Total financial assets 15,095,864 4,811,525 8,290,288 30,725,527 17,299,630 76,222,834<br />
_________ _______ _________ _________ _________ __________<br />
Financial liabilities<br />
Balances due to banks 131,643 - - - - 131,643<br />
Customer deposits 31,199,548 5,101,986 21,691,306 4,718,018 - 62,710,859<br />
Borrowings - - 135,284 3,442,517 2,009,920 5,587,720<br />
Other liabilities 158,676 - - - - 158,676<br />
__________ _________ _________ _________ _________ __________<br />
Total financial liabilities 31,489,867 5,101,986 21,826,590 8,160,535 2,009,920 68,588,898<br />
__________ _________ _________ _________ _________ __________<br />
Net liquidity gap (16,394,003) (290,461) (13,536,302) 22,564,992 15,289,710 7,633,936<br />
========== ========= ========= ========= ========= =========<br />
As at 31 December 2014<br />
Total financial assets 14,169,796 2,395,196 5,426,708 21,616,810 14,681,910 58,290,420<br />
Total financial liabilities 27,327,619 3,208,179 13,752,115 6,108,907 - 50,396,820<br />
___________ __________ __________ _________ __________ __________<br />
Net liquidity gap (13,157,823) (812,983) (8,325,407) 15,507,903 14,681,910 7,893,600<br />
========== ========= ========= ======== ========= =========<br />
The above table shows the undiscounted cash flows on the group’s financial liabilities and unrecognised loan commitments<br />
on the basis of their earliest possible contractual maturity. The group’s expected cash flows on these instruments<br />
vary significantly from this analysis.<br />
69