Annual REPORT
2015-Annual-Report-Financial-Statements
2015-Annual-Report-Financial-Statements
You also want an ePaper? Increase the reach of your titles
YUMPU automatically turns print PDFs into web optimized ePapers that Google loves.
ANNUAL <strong>REPORT</strong> AND FINANCIAL STATEMENTS<br />
FOR THE YEAR ENDED 31 DECEMBER 2015<br />
NOTES TO THE FINANCIAL STATEMENTS (Continued)<br />
4 FINANCIAL RISK MANAGEMENT OBJECTIVES AND POLICIES (Continued)<br />
(c)<br />
ii)<br />
Market risks (continued)<br />
Interest Rate Risks – increase/decrease of 10% in net interest margin<br />
The Interest Rate Risks sensitivity analysis is based on the following assumptions.<br />
· Changes in the market interest rates affect the interest income or expenses of variable interest financial instruments.<br />
· Changes in Market interest rates only affect interest income or expenses in relation to financial instruments with<br />
fixed interest rates if these are recognized at their fair value.<br />
· The interest rate changes will have a significant effect on interest sensitive assets and liabilities and hence simulation<br />
modelling is applied to Net interest margins.<br />
· The interest rates of all maturities move by the same amount and, therefore, do not reflect the potential impact<br />
on net interest income of some rates changing while others remain unchanged.<br />
· The projections make other assumptions including that all positions run to maturity.<br />
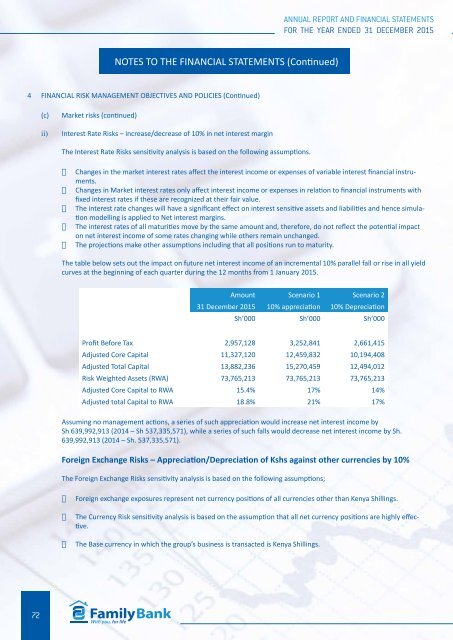
The table below sets out the impact on future net interest income of an incremental 10% parallel fall or rise in all yield<br />
curves at the beginning of each quarter during the 12 months from 1 January 2015.<br />
Amount Scenario 1 Scenario 2<br />
31 December 2015 10% appreciation 10% Depreciation<br />
Sh’000 Sh’000 Sh’000<br />
Profit Before Tax 2,957,128 3,252,841 2,661,415<br />
Adjusted Core Capital 11,327,120 12,459,832 10,194,408<br />
Adjusted Total Capital 13,882,236 15,270,459 12,494,012<br />
Risk Weighted Assets (RWA) 73,765,213 73,765,213 73,765,213<br />
Adjusted Core Capital to RWA 15.4% 17% 14%<br />
Adjusted total Capital to RWA 18.8% 21% 17%<br />
Assuming no management actions, a series of such appreciation would increase net interest income by<br />
Sh 639,992,913 (2014 – Sh 537,335,571), while a series of such falls would decrease net interest income by Sh.<br />
639,992,913 (2014 – Sh. 537,335,571).<br />
Foreign Exchange Risks – Appreciation/Depreciation of Kshs against other currencies by 10%<br />
The Foreign Exchange Risks sensitivity analysis is based on the following assumptions;<br />
· Foreign exchange exposures represent net currency positions of all currencies other than Kenya Shillings.<br />
· The Currency Risk sensitivity analysis is based on the assumption that all net currency positions are highly effective.<br />
· The Base currency in which the group’s business is transacted is Kenya Shillings.<br />
72


