- Page 1 and 2:
ANNUAL DANISH INfORMATIVE INVENTORY
- Page 3 and 4:
AU ANNUAL DANISH INfORMATIVE INVENT
- Page 5 and 6:
&RQWHQWV 6XPPDU\ , %DFNJURXQG LQIRU
- Page 7:
Annex 2A-11 QA/QC for stationary co
- Page 10 and 11:
8 ,, 7UHQGV LQ HPLVVLRQV $FLGLI\LQJ
- Page 12 and 13:
10 reduced emissions is mainly incr
- Page 14 and 15:
12 Danish energy statistics have, f
- Page 16 and 17:
14 ,QGXVWULDO SURFHVVHV Recalculati
- Page 18 and 19:
16 ,, 8GYLNOLQJHQ L HPLVVLRQHU )RUV
- Page 20 and 21:
18 kilde til emission af kobber er
- Page 22 and 23:
20 6¡IDUW Brændselsforbrug for sk
- Page 24 and 25:
22 en stigning i NH3 emissionen for
- Page 26 and 27:
24 UNECE-LRTAP Convention of the An
- Page 28 and 29:
26 Table 1.1 List of current data s
- Page 30 and 31:
28 A list of all subsectors at the
- Page 32 and 33:
30 )XJLWLYH HPLVVLRQV IURP QDWXUDO
- Page 34 and 35:
32 Please refer to Chapter 5 for fu
- Page 36 and 37:
34 Table 1.2 Danish uncertainty est
- Page 38 and 39:
36 NR is used for pollutants prior
- Page 40 and 41:
38 �������� Acid-
- Page 42 and 43:
40 ����������
- Page 44 and 45:
42 ����������
- Page 46 and 47:
44 �� Industrial Processes 1% N
- Page 48 and 49:
46 ����� Non-industrial
- Page 50 and 51:
48 Table 3.1 NFR source categories
- Page 52 and 53:
50 (PLVVLRQ VRXUFH FDWHJRULHV In th
- Page 54 and 55:
52 Fuel consumption, PJ Fuel consum
- Page 56 and 57:
54 sumption in ,QGXVWU\ in 2009 add
- Page 58 and 59:
56 (PLVVLRQV 62� Stationary combu
- Page 60 and 61:
58 the reduced emission from electr
- Page 62 and 63:
60 NMVOC, Gg 25 20 15 10 5 0 1990 1
- Page 64 and 65:
62 The primary sources of PM emissi
- Page 66 and 67:
64 PM, Gg PM 2.5, Gg 30 25 20 15 10
- Page 68 and 69:
66 Table 3.11 Decrease in heavy met
- Page 70 and 71:
68 3$+ Stationary combustion plants
- Page 72 and 73:
70 Benzo(a)pyrene Benzo(a)pyrene, M
- Page 74 and 75:
72 plants has increased due to incr
- Page 76 and 77:
74 Fuel consumption, PJ SO2, Gg____
- Page 78 and 79:
As, Mg_____ Cd, Mg_____ Cr, Mg_____
- Page 80 and 81:
78 SO2, Gg____ NOx, Gg_____ Fuel co
- Page 82 and 83:
80 SO2, Gg____ NOx, Gg_____ Fuel co
- Page 84 and 85:
82 Fuel consumption, PJ 90 80 70 60
- Page 86 and 87:
84 As, Mg_____ 0.00 0.05 0.10 0.15
- Page 88 and 89:
86 Fuel consumption, PJ 1A4 Other S
- Page 90 and 91:
88 As, Mg Cd, Mg Cr, Mg Cu, Mg Hg,
- Page 92 and 93:
90 SO2, Gg____ NOx, Gg_____ Fuel co
- Page 94 and 95:
92 SO2, Gg____ NOx, Gg_____ Fuel co
- Page 96 and 97: 94 software for inventories. The me
- Page 98 and 99: 96 Both traded and non-traded fuels
- Page 100 and 101: 98 ƒ Christiansen et al. (1997).
- Page 102 and 103: 100 The emission factors for decent
- Page 104 and 105: 102 Table 3.19 Danish uncertainty e
- Page 106 and 107: 104 Danish Energy Agency (DEA), 201
- Page 108 and 109: 106 Miljøstyrelsen (MST), 2010: An
- Page 110 and 111: 108 Table 3.20 SNAP - NFR correspon
- Page 112 and 113: 110 sumption development is due to
- Page 114 and 115: 112 these types of machinery, the D
- Page 116 and 117: 114 � � 5 4,5 4 3,5 3 2,5 2 1,5
- Page 118 and 119: 116 Table 3.22 Emissions of SO2, NO
- Page 120 and 121: 118 7RQQHV 600000 500000 400000 300
- Page 122 and 123: 120 7RQQHV 8000 7000 6000 5000 4000
- Page 124 and 125: 122 The TSP emission development fo
- Page 126 and 127: 124 Residential (1A4b) 0% Agr./for.
- Page 128 and 129: 126 Table 3.24 Heavy metal emission
- Page 130 and 131: 128 Navigation (1A3d) 79% Navigatio
- Page 132 and 133: 130 Table 3.25 Dioxin and PAH emiss
- Page 134 and 135: 132 Residential (1A4b) 2% Railways
- Page 136 and 137: 134 0HWKRGRORJLFDO LVVXHV The descr
- Page 138 and 139: 136 1200 1000 � � Ã � 800 Ã
- Page 140 and 141: 138 2000 � 1600 � � � 1
- Page 142 and 143: 140 Table 3.28 Overview of the exis
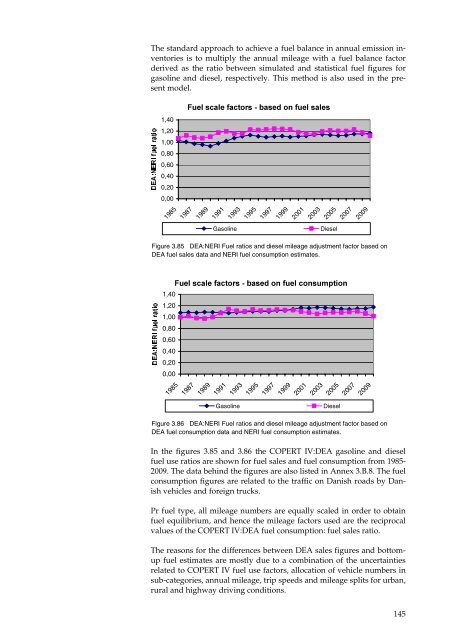
- Page 144 and 145: 142 8') 8 ⋅ 07& + 8 = , MTC < UMA
- Page 148 and 149: 146 The final fuel use and emission
- Page 150 and 151: 148 Figure 3.87 Most frequent domes
- Page 152 and 153: 150 No. No. 30000 25000 20000 15000
- Page 154 and 155: 152 [No] 4500 4000 3500 3000 2500 2
- Page 156 and 157: 154 ��� ��� ���
- Page 158 and 159: 156 Table 3.30 Domestic ferry route
- Page 160 and 161: 158 national sea transport in the D
- Page 162 and 163: 160 Table 3.32 Overview of the EU E
- Page 164 and 165: Table 3.35 Current certification li
- Page 166 and 167: 164 Table 3.37 Current legislation
- Page 168 and 169: 166 Table 3.38 Fuel based emission
- Page 170 and 171: 168 1RQ URDG ZRUNLQJ PDFKLQHU\ DQG
- Page 172 and 173: 170 ( = )& ⋅ () (27) where E = em
- Page 174 and 175: 172 tions, transport to Greenland a
- Page 176 and 177: 174 5RDG WUDQVSRUW The total mileag
- Page 178 and 179: 176 Delvig, P. 2010: Unpublished da
- Page 180 and 181: 178 Winther, M. 2005: Kyoto notat -
- Page 182 and 183: 180 Table 3.41 Summary of the Danis
- Page 184 and 185: 182 2IIVKRUH DFWLYLWLHV Fugitive em
- Page 186 and 187: 184 Coal import, Gg . 16000 14000 1
- Page 188 and 189: 186 gasoline sales show an increase
- Page 190 and 191: 188 Venting in gas treatment and st
- Page 192 and 193: 190 and Kilde (1994) for the years
- Page 194 and 195: 192 Table 3.48 Emission factors for
- Page 196 and 197:
194 Table 3.54 Emissions of NMVOC f
- Page 198 and 199:
196 and initialisation of new facil
- Page 200 and 201:
198 Table 3.59 Estimated emission u
- Page 202 and 203:
200 Extraction of oil and gas: fugi
- Page 204 and 205:
202 OleQGU\ QVNL � ' EVNL % 6NR V
- Page 206 and 207:
204 Table 4.1 Survey of industrial
- Page 208 and 209:
206 Table 4.2 Time-series for pollu
- Page 210 and 211:
208 financial crises. During the sa
- Page 212 and 213:
210 1 1 1 1 1 0 0 0 0 0 &KHPLFDO LQ
- Page 214 and 215:
212 they have not been subject to t
- Page 216 and 217:
214 Denmark. The emission of TSP an
- Page 218 and 219:
216 Table 4.3 Emission factors for
- Page 220 and 221:
218 2WKHU SURGXFWLRQ FRQVXPSWLRQ VW
- Page 222 and 223:
220 Nielsen, O.-K., Lyck, E., Mikke
- Page 224 and 225:
222 products is derived from Table
- Page 226 and 227:
224 kt NMVOC/year 60 50 40 30 20 10
- Page 228 and 229:
226 tained from the respective comp
- Page 230 and 231:
228 over several years so there wil
- Page 232 and 233:
230 8QFHUWDLQWLHV DQG WLPH VHULHV F
- Page 234 and 235:
232 powder consists of about 75 % o
- Page 236 and 237:
234 Passant et al. (2003) and Fyrve
- Page 238 and 239:
236 Table 5.9 Emission from firewor
- Page 240 and 241:
238 sumentfyrverkerier, Miljö Göt
- Page 242 and 243:
240 $JULFXOWXUH 1)5 VHFWRU 2YHUYLHZ
- Page 244 and 245:
242 Another important cause of the
- Page 246 and 247:
244 The emissions from agricultural
- Page 248 and 249:
246 Table 6.3 Livestock categories
- Page 250 and 251:
248 Table 6.4 Livestock production
- Page 252 and 253:
250 creasing. This is due to measur
- Page 254 and 255:
252 Table 6.7 Activity data used to
- Page 256 and 257:
254 Table 6.10 Activity data used t
- Page 258 and 259:
256 Table 6.13 Livestock categories
- Page 260 and 261:
258 Table 6.16 PM emission from hou
- Page 262 and 263:
260 swine production, etc to optimi
- Page 264 and 265:
262 ning, as given in the CLRTAP Em
- Page 266 and 267:
264 implemented NH3 reduction techn
- Page 268 and 269:
266 :DVWH 1)5 VHFWRU The waste sect
- Page 270 and 271:
268 0HWKRGRORJ\ +XPDQ FUHPDWLRQ The
- Page 272 and 273:
270 Even though the total number of
- Page 274 and 275:
272 statistic data show an increase
- Page 276 and 277:
274 an emission factor of 28 µg pr
- Page 278 and 279:
276 Table 7.8 Emission factors for
- Page 280 and 281:
278 Table 7.9b Total national emiss
- Page 282 and 283:
280 Table 7.10a Total national emis
- Page 284 and 285:
282 Table 7.11 Estimated uncertaint
- Page 286 and 287:
284 Table 7.13 Overview of yearly s
- Page 288 and 289:
286 Data Processing level 1 1. Accu
- Page 290 and 291:
288 Data Storage level 2 The full d
- Page 292 and 293:
290 Date=06%2F30%2F2004&_sk=9994499
- Page 294 and 295:
292 Amount composted, Gg 1200 1000
- Page 296 and 297:
294 • 50 kg waste pr year will in
- Page 298 and 299:
296 Affaldsstatistik 2007 og 2008 (
- Page 300 and 301:
298 and 5 % of a large fire respect
- Page 302 and 303:
300 for fire-fighting and will typi
- Page 304 and 305:
302 Table 7.21 Different types of n
- Page 306 and 307:
304 Table 7.22 Average vehicle mass
- Page 308 and 309:
306 Table 7.23 Emission factors bui
- Page 310 and 311:
308 material estimated in Persson e
- Page 312 and 313:
310 Table 7.26 Emission factors veh
- Page 314 and 315:
Table 7.27a National emissions from
- Page 316 and 317:
314 Table 7.28b National emissions
- Page 318 and 319:
316 UNEP toolkit, 2005: United Nati
- Page 320 and 321:
318 4$ 4& DQG YHULILFDWLRQ 4$ 4& SU
- Page 322 and 323:
320 These references exist in the d
- Page 324 and 325:
322 Data Processing level 1 For the
- Page 326 and 327:
324 2WKHU DQG QDWXUDO HPLVVLRQV Den
- Page 328 and 329:
326 similar methodology was used fo
- Page 330 and 331:
328 the localisation of the Danish
- Page 332 and 333:
330 • The national energy statist
- Page 334 and 335:
332 the Energy Statistics for 2009
- Page 336 and 337:
334 $QQH[ ± �H\ FDWHJRU\ DQDO\VL
- Page 338 and 339:
336 $QQH[ $ ,3&& 61$3 VRXUFH FRUUHV
- Page 340 and 341:
338 $QQH[ $ )XHO UDWH Table 2A-2.1
- Page 342 and 343:
340 Table 2A-2.2 Detailed fuel cons
- Page 344 and 345:
342 ���������Ã
- Page 346 and 347:
344 ���������Ã
- Page 348 and 349:
346 ���������Ã
- Page 350 and 351:
348 ���������Ã
- Page 352 and 353:
Table 56 Time-series for calorific
- Page 354 and 355:
$QQH[ $ (PLVVLRQ IDFWRUV Table 2A-4
- Page 356 and 357:
14. Danish Gas Technology Centre 20
- Page 358 and 359:
pollutant fuel_type fuel nfr nfr_na
- Page 360 and 361:
pollutant fuel_type fuel nfr nfr_na
- Page 362 and 363:
pollutant fuel_type fuel nfr nfr_na
- Page 364 and 365:
pollutant fuel_type fuel nfr nfr_na
- Page 366 and 367:
à Ãà Ãà Ãà Ãà ���Ã
- Page 368 and 369:
Table 2A-4.4a PM emission factors,
- Page 370 and 371:
Table 2A-4.5 HM emission factors (m
- Page 372 and 373:
��������à ��
- Page 374 and 375:
��������à ��
- Page 376 and 377:
��������à ��
- Page 378 and 379:
��������à ��
- Page 380 and 381:
378 Ã ÃÃ ÃÃ ÃÃ ÃÃ Benzo(a)
- Page 382 and 383:
Table 2A-4.9a PAH emission factors
- Page 384 and 385:
Table 2A-4.9b PAH emission factors
- Page 386 and 387:
Table 2A-4.10 Dioxin and HCB emissi
- Page 388 and 389:
Table 2A-4.11a Dioxin and HCB emiss
- Page 390 and 391:
Table 2A-4.12 NH3 emission factors
- Page 392 and 393:
$QQH[ $ /DUJH SRLQW VRXUFHV Table 2
- Page 394 and 395:
02 MUNICIP. WASTES 44 STRAW 25 Hade
- Page 396 and 397:
��������� 049 Ren
- Page 398 and 399:
396 national emissions in year t du
- Page 400 and 401:
398 ���������à S
- Page 402 and 403:
400 ���������à S
- Page 404 and 405:
402 ���������à S
- Page 406 and 407:
��������� 20205 0
- Page 408 and 409:
406 • Monthly reporting by e-mail
- Page 410 and 411:
408 �������à �
- Page 412 and 413:
410 �������à �
- Page 414 and 415:
412 $QQH[ $ 7LPH VHULHV Fuel consum
- Page 416 and 417:
Table 6.1 List of external data sou
- Page 418 and 419:
416 however, included in the refere
- Page 420 and 421:
418 Data Processing level 1 3.Compl
- Page 422 and 423:
420 Some automated checks have been
- Page 424 and 425:
$QQH[ % )OHHW GDWD IRU URDG WUDQVSR
- Page 426 and 427:
���������à Secto
- Page 428 and 429:
���������à Secto
- Page 430 and 431:
���������à Secto
- Page 432 and 433:
���������à Secto
- Page 434 and 435:
���������à Secto
- Page 436 and 437:
���������à Secto
- Page 438 and 439:
���������à Secto
- Page 440 and 441:
���������à Secto
- Page 442 and 443:
���������à Secto
- Page 444 and 445:
���������à Secto
- Page 446 and 447:
444 $QQH[ % (8 GLUHFWLYH HPLVVLRQ O
- Page 448 and 449:
$QQH[ % %DVLV HPLVVLRQ IDFWRUV J SU
- Page 450 and 451:
���������à Secto
- Page 452 and 453:
���������à Secto
- Page 454 and 455:
���������à Secto
- Page 456 and 457:
���������à Secto
- Page 458 and 459:
$QQH[ % 5HGXFWLRQ IDFWRUV Sector Su
- Page 460 and 461:
���������à Secto
- Page 462 and 463:
���������à Secto
- Page 464 and 465:
���������à Secto
- Page 466 and 467:
���������à Secto
- Page 468 and 469:
���������à Secto
- Page 470 and 471:
���������à Secto
- Page 472 and 473:
$QQH[ % )XHO XVH *- DQG HPLVVLRQV W
- Page 474 and 475:
���������à Secto
- Page 476 and 477:
���������à Secto
- Page 478 and 479:
$QQH[ % %DVLV IXHO FRQVXPSWLRQ DQG
- Page 480 and 481:
Basis factors for 2-stroke gasoline
- Page 482 and 483:
CH4 shares of VOC for diesel, gasol
- Page 484 and 485:
Annual working hours, load factors
- Page 486 and 487:
Operational data for the most impor
- Page 488 and 489:
���������à Size
- Page 490 and 491:
���������à Size
- Page 492 and 493:
���������à Size
- Page 494 and 495:
���������à Size
- Page 496 and 497:
���������à FuelC
- Page 498 and 499:
���������à Equip
- Page 500 and 501:
���������à Equip
- Page 502 and 503:
Stock data for household and garden
- Page 504 and 505:
���������à SNAP
- Page 506 and 507:
Stock data for small boats and plea
- Page 508 and 509:
$QQH[ % 7UDIILF GDWD DQG GLIIHUHQW
- Page 510 and 511:
���������à Ferry
- Page 512 and 513:
Ferry data: Sailing time (single tr
- Page 514 and 515:
���������à Ferry
- Page 516 and 517:
���������à Ferry
- Page 518 and 519:
���������à Ferry
- Page 520 and 521:
���������à High
- Page 522 and 523:
���������à High
- Page 524 and 525:
���������à 522 H
- Page 526 and 527:
���������à Fuel
- Page 528 and 529:
���������à 1985
- Page 530 and 531:
���������à 1985
- Page 532 and 533:
���������à 2000
- Page 534 and 535:
��������� SNAP ID
- Page 536 and 537:
���������à Year
- Page 538 and 539:
��������� SNAP ID
- Page 540 and 541:
���������à Year
- Page 542 and 543:
Year Source Category TSP PM10 PM2.5
- Page 544 and 545:
��������� SNAP ID
- Page 546 and 547:
��������� SNAP ID
- Page 548 and 549:
���������à SNAP
- Page 550 and 551:
���������à 548 S
- Page 552 and 553:
���������à 550 S
- Page 554 and 555:
���������à 552 S
- Page 556 and 557:
���������à 554 S
- Page 558 and 559:
���������à 556 S
- Page 560 and 561:
Emissions pol_name IPCC ID Unit 198
- Page 562 and 563:
���������à pol_n
- Page 564 and 565:
���������à pol_n
- Page 566 and 567:
���������à pol_n
- Page 568 and 569:
���������à pol_n
- Page 570 and 571:
���������à pol_n
- Page 572 and 573:
���������à pol_n
- Page 574 and 575:
���������à pol_n
- Page 576 and 577:
���������à pol_n
- Page 578 and 579:
$QQH[ % 8QFHUWDLQW\ HVWLPDWHV Uncer
- Page 580 and 581:
Uncertainty estimation, NH3. 578 Ga
- Page 582 and 583:
Uncertainty estimation, Chromium. 5
- Page 584 and 585:
Uncertainty estimation, Lead. 582 G
- Page 586 and 587:
Uncertainty estimation, Flouranthen
- Page 588 and 589:
Uncertainty estimation, Benzo(g,h,i
- Page 590 and 591:
588 Table 2C.1a Nitrogen excretion
- Page 592 and 593:
590 (PLVVLRQ RI 1+ � +RXVLQJ The
- Page 594 and 595:
592 $QQH[ & %DFNJURXQG LQIRUPDWLRQ
- Page 596 and 597:
594 $QQH[ & %DFNJURXQG LQIRUPDWLRQ
- Page 598 and 599:
596 $QQH[ ± &RPSOHWHQHVV DQG XVH R
- Page 600 and 601:
598 Emissions from clinical, indust
- Page 602 and 603:
NERI DMU National Environmental Res
- Page 604 and 605:
[Blank page]