a market conditions and project evaluation summary of - Georgia ...
a market conditions and project evaluation summary of - Georgia ...
a market conditions and project evaluation summary of - Georgia ...

You also want an ePaper? Increase the reach of your titles
YUMPU automatically turns print PDFs into web optimized ePapers that Google loves.
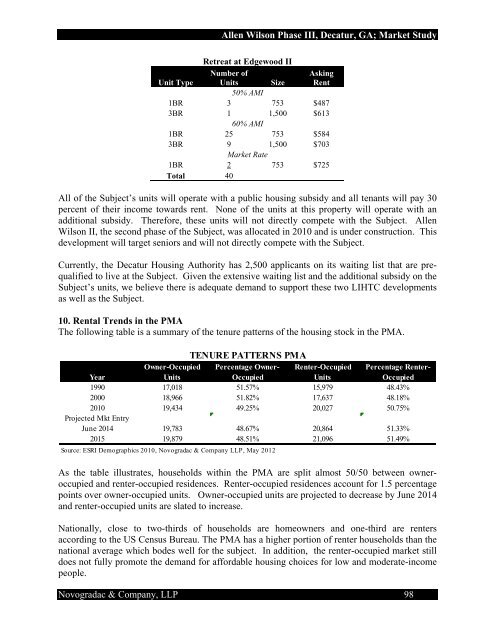
Allen Wilson Phase III, Decatur, GA; Market Study<br />
Retreat at Edgewood II<br />
Number <strong>of</strong><br />
Asking<br />
Unit Type Units<br />
50% AMI<br />
Size Rent<br />
1BR 3 753 $487<br />
3BR 1<br />
60% AMI<br />
1,500 $613<br />
1BR 25 753 $584<br />
3BR 9 1,500 $703<br />
1BR<br />
Market Rate<br />
2 753 $725<br />
Total 40<br />
All <strong>of</strong> the Subject’s units will operate with a public housing subsidy <strong>and</strong> all tenants will pay 30<br />
percent <strong>of</strong> their income towards rent. None <strong>of</strong> the units at this property will operate with an<br />
additional subsidy. Therefore, these units will not directly compete with the Subject. Allen<br />
Wilson II, the second phase <strong>of</strong> the Subject, was allocated in 2010 <strong>and</strong> is under construction. This<br />
development will target seniors <strong>and</strong> will not directly compete with the Subject.<br />
Currently, the Decatur Housing Authority has 2,500 applicants on its waiting list that are prequalified<br />
to live at the Subject. Given the extensive waiting list <strong>and</strong> the additional subsidy on the<br />
Subject’s units, we believe there is adequate dem<strong>and</strong> to support these two LIHTC developments<br />
as well as the Subject.<br />
10. Rental Trends in the PMA<br />
The following table is a <strong>summary</strong> <strong>of</strong> the tenure patterns <strong>of</strong> the housing stock in the PMA.<br />
TENURE PATTERNS PMA<br />
Owner-Occupied Percentage Owner- Renter-Occupied Percentage Renter-<br />
Year<br />
Units<br />
Occupied<br />
Units<br />
Occupied<br />
1990 17,018 51.57% 15,979 48.43%<br />
2000 18,966 51.82% 17,637 48.18%<br />
2010<br />
Projected Mkt Entry<br />
19,434 49.25% 20,027 50.75%<br />
June 2014 19,783 48.67% 20,864 51.33%<br />
2015 19,879 48.51% 21,096 51.49%<br />
Source: ESRI Demographics 2010, Novogradac & Company LLP, May 2012<br />
As the table illustrates, households within the PMA are split almost 50/50 between owneroccupied<br />
<strong>and</strong> renter-occupied residences. Renter-occupied residences account for 1.5 percentage<br />
points over owner-occupied units. Owner-occupied units are <strong>project</strong>ed to decrease by June 2014<br />
<strong>and</strong> renter-occupied units are slated to increase.<br />
Nationally, close to two-thirds <strong>of</strong> households are homeowners <strong>and</strong> one-third are renters<br />
according to the US Census Bureau. The PMA has a higher portion <strong>of</strong> renter households than the<br />
national average which bodes well for the subject. In addition, the renter-occupied <strong>market</strong> still<br />
does not fully promote the dem<strong>and</strong> for affordable housing choices for low <strong>and</strong> moderate-income<br />
people.<br />
Novogradac & Company, LLP 98