a market conditions and project evaluation summary of - Georgia ...
a market conditions and project evaluation summary of - Georgia ...
a market conditions and project evaluation summary of - Georgia ...

Create successful ePaper yourself
Turn your PDF publications into a flip-book with our unique Google optimized e-Paper software.
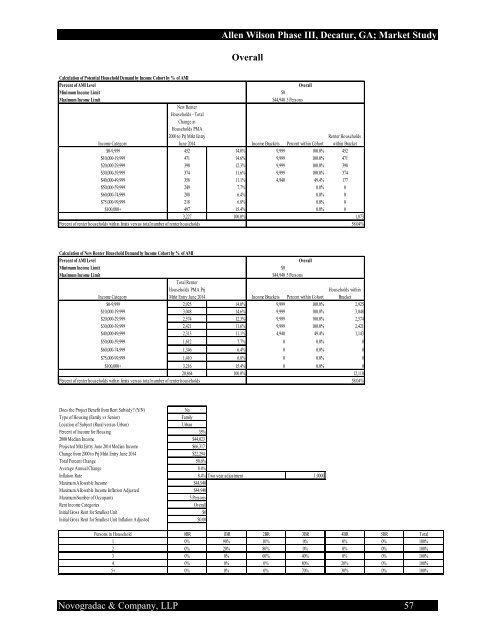
Allen Wilson Phase III, Decatur, GA; Market Study<br />
Overall<br />
Calculation <strong>of</strong> Potential Household Dem<strong>and</strong> by Income Cohort by % <strong>of</strong> AMI<br />
Percent <strong>of</strong> AMI Level<br />
Overall<br />
Minimum Income Limit $0<br />
Maximum Income Limit $44,940 5 Persons<br />
Income Category<br />
New Renter<br />
Households - Total<br />
Change in<br />
Households PMA<br />
2000 to Prj Mrkt Entry<br />
June 2014 Income Brackets Percent within Cohort<br />
Renter Households<br />
within Bracket<br />
$0-9,999 452 14.0% 9,999 100.0% 452<br />
$10,000-19,999 471 14.6% 9,999 100.0% 471<br />
$20,000-29,999 398 12.3% 9,999 100.0% 398<br />
$30,000-39,999 374 11.6% 9,999 100.0% 374<br />
$40,000-49,999 358 11.1% 4,940 49.4% 177<br />
$50,000-59,999 249 7.7% 0.0% 0<br />
$60,000-74,999 208 6.4% 0.0% 0<br />
$75,000-99,999 218 6.8% 0.0% 0<br />
$100,000+ 497 15.4% 0.0% 0<br />
3,227 100.0% 1,873<br />
Percent <strong>of</strong> renter households within limits versus total number <strong>of</strong> renter households 58.04%<br />
Check OK<br />
Calculation <strong>of</strong> New Renter Household Dem<strong>and</strong> by Income Cohort by % <strong>of</strong> AMI<br />
Percent <strong>of</strong> AMI Level Overall<br />
0%<br />
Minimum Income Limit $0 $0<br />
Maximum Income Limit $44,940 5 Persons $0<br />
Total Renter<br />
Households PMA Prj<br />
Households within<br />
Income Category<br />
Mrkt Entry June 2014 Income Brackets Percent within Cohort Bracket Income Brackets<br />
$0-9,999 2,925 14.0% 9,999 100.0% 2,925 0<br />
$10,000-19,999 3,048 14.6% 9,999 100.0% 3,048 0<br />
$20,000-29,999 2,574 12.3% 9,999 100.0% 2,574 0<br />
$30,000-39,999 2,421 11.6% 9,999 100.0% 2,421 0<br />
$40,000-49,999 2,313 11.1% 4,940 49.4% 1,143 0<br />
$50,000-59,999 1,612 7.7% 0 0.0% 0 0<br />
$60,000-74,999 1,346 6.4% 0 0.0% 0<br />
$75,000-99,999 1,410 6.8% 0 0.0% 0<br />
$100,000+ 3,216 15.4% 0 0.0% 0<br />
20,864 100.0% 12,110<br />
Percent <strong>of</strong> renter households within limits versus total number <strong>of</strong> renter households 58.04%<br />
Check OK<br />
Does the Project Benefit from Rent Subsidy? (Y/N) No<br />
Type <strong>of</strong> Housing (Family vs Senior) Family<br />
Location <strong>of</strong> Subject (Rural versus Urban) Urban<br />
Percent <strong>of</strong> Income for Housing 35%<br />
2000 Median Income $44,023<br />
Projected Mkt Entry June 2014 Median Income $66,317<br />
Change from 2000 to Prj Mrkt Entry June 2014 $22,294<br />
Total Percent Change 50.6%<br />
Average Annual Change 8.4%<br />
Inflation Rate 8.4% Two year adjustment 1.0000<br />
Maximum Allowable Income $44,940<br />
Maximum Allowable Income Inflation Adjusted $44,940<br />
Maximum Number <strong>of</strong> Occupants 5 Persons<br />
Rent Income Categories Overall<br />
Initial Gross Rent for Smallest Unit $0<br />
Initial Gross Rent for Smallest Unit Inflation Adjusted $0.00<br />
Persons in Household 0BR 1BR 2BR 3BR 4BR 5BR Total<br />
1 0% 90% 10% 0% 0% 0% 100%<br />
2 0% 20% 80% 0% 0% 0% 100%<br />
3 0% 0% 60% 40% 0% 0% 100%<br />
4 0% 0% 0% 80% 20% 0% 100%<br />
5+ 0% 0% 0% 70% 30% 0% 100%<br />
Novogradac & Company, LLP 57