a market conditions and project evaluation summary of - Georgia ...
a market conditions and project evaluation summary of - Georgia ...
a market conditions and project evaluation summary of - Georgia ...

You also want an ePaper? Increase the reach of your titles
YUMPU automatically turns print PDFs into web optimized ePapers that Google loves.
Allen Wilson Phase III, Decatur, GA; Market Study<br />
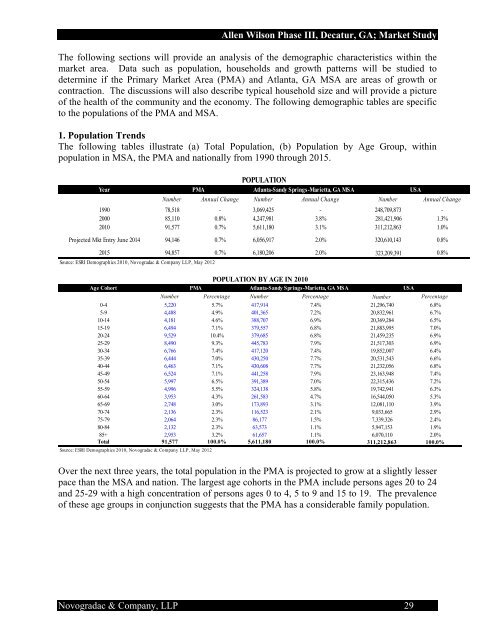
The following sections will provide an analysis <strong>of</strong> the demographic characteristics within the<br />
<strong>market</strong> area. Data such as population, households <strong>and</strong> growth patterns will be studied to<br />
determine if the Primary Market Area (PMA) <strong>and</strong> Atlanta, GA MSA are areas <strong>of</strong> growth or<br />
contraction. The discussions will also describe typical household size <strong>and</strong> will provide a picture<br />
<strong>of</strong> the health <strong>of</strong> the community <strong>and</strong> the economy. The following demographic tables are specific<br />
to the populations <strong>of</strong> the PMA <strong>and</strong> MSA.<br />
1. Population Trends<br />
The following tables illustrate (a) Total Population, (b) Population by Age Group, within<br />
population in MSA, the PMA <strong>and</strong> nationally from 1990 through 2015.<br />
Year PMA<br />
POPULATION<br />
Atlanta-S<strong>and</strong>y Springs-Marietta, GA MSA USA<br />
Number Annual Change Number Annual Change Number Annual Change<br />
1990 78,518 - 3,069,425 - 248,709,873 -<br />
2000 85,110 0.8% 4,247,981 3.8% 281,421,906 1.3%<br />
2010 91,577 0.7% 5,611,180 3.1% 311,212,863 1.0%<br />
Projected Mkt Entry June 2014 94,146 0.7% 6,056,917 2.0% 320,610,143 0.8%<br />
2015 94,857 0.7% 6,180,206 2.0% 323,209,391 0.8%<br />
Source: ESRI Demographics 2010, Novogradac & Company LLP, May 2012<br />
POPULATION BY AGE IN 2010<br />
Age Cohort PMA Atlanta-S<strong>and</strong>y Springs-Marietta, GA MSA USA<br />
Number Percentage Number Percentage Number Percentage<br />
0-4 5,220 5.7% 417,914 7.4% 21,296,740 6.8%<br />
5-9 4,488 4.9% 401,365 7.2% 20,832,961 6.7%<br />
10-14 4,181 4.6% 388,707 6.9% 20,369,284 6.5%<br />
15-19 6,494 7.1% 379,557 6.8% 21,883,995 7.0%<br />
20-24 9,529 10.4% 379,685 6.8% 21,459,235 6.9%<br />
25-29 8,490 9.3% 445,783 7.9% 21,517,303 6.9%<br />
30-34 6,766 7.4% 417,120 7.4% 19,852,007 6.4%<br />
35-39 6,444 7.0% 430,250 7.7% 20,531,543 6.6%<br />
40-44 6,463 7.1% 430,608 7.7% 21,232,056 6.8%<br />
45-49 6,524 7.1% 441,258 7.9% 23,163,948 7.4%<br />
50-54 5,997 6.5% 391,389 7.0% 22,315,436 7.2%<br />
55-59 4,996 5.5% 324,138 5.8% 19,742,941 6.3%<br />
60-64 3,953 4.3% 261,583 4.7% 16,544,050 5.3%<br />
65-69 2,748 3.0% 173,893 3.1% 12,081,110 3.9%<br />
70-74 2,136 2.3% 116,523 2.1% 9,033,665 2.9%<br />
75-79 2,064 2.3% 86,177 1.5% 7,339,326 2.4%<br />
80-84 2,132 2.3% 63,573 1.1% 5,947,153 1.9%<br />
85+ 2,953 3.2% 61,657 1.1% 6,070,110 2.0%<br />
Total 91,577 100.0% 5,611,180 100.0% 311,212,863 100.0%<br />
Source: ESRI Demographics 2010, Novogradac & Company LLP, May 2012<br />
Over the next three years, the total population in the PMA is <strong>project</strong>ed to grow at a slightly lesser<br />
pace than the MSA <strong>and</strong> nation. The largest age cohorts in the PMA include persons ages 20 to 24<br />
<strong>and</strong> 25-29 with a high concentration <strong>of</strong> persons ages 0 to 4, 5 to 9 <strong>and</strong> 15 to 19. The prevalence<br />
<strong>of</strong> these age groups in conjunction suggests that the PMA has a considerable family population.<br />
Novogradac & Company, LLP 29