a market conditions and project evaluation summary of - Georgia ...
a market conditions and project evaluation summary of - Georgia ...
a market conditions and project evaluation summary of - Georgia ...

Create successful ePaper yourself
Turn your PDF publications into a flip-book with our unique Google optimized e-Paper software.
Allen Wilson Phase III, Decatur, GA; Market Study<br />
Income Cohort 2010<br />
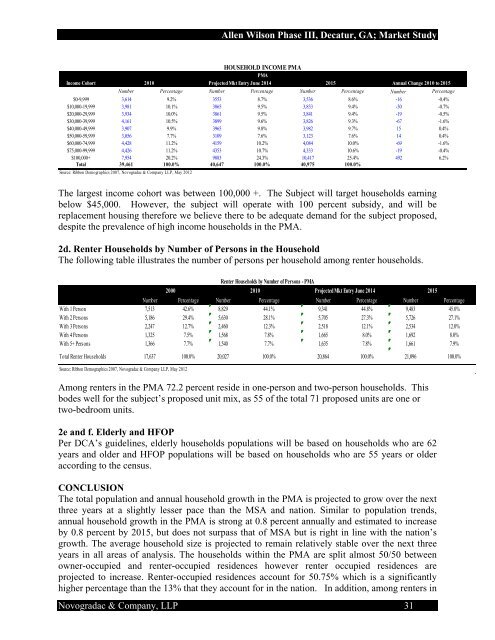
HOUSEHOLD INCOME PMA<br />
PMA<br />
Projected Mkt Entry June 2014 2015 Annual Change 2010 to 2015<br />
Number Percentage Number Percentage Number Percentage Number Percentage<br />
$0-9,999 3,614 9.2% 3553 8.7% 3,536 8.6% -16 -0.4%<br />
$10,000-19,999 3,981 10.1% 3865 9.5% 3,833 9.4% -30 -0.7%<br />
$20,000-29,999 3,934 10.0% 3861 9.5% 3,841 9.4% -19 -0.5%<br />
$30,000-39,999 4,161 10.5% 3899 9.6% 3,826 9.3% -67 -1.6%<br />
$40,000-49,999 3,907 9.9% 3965 9.8% 3,982 9.7% 15 0.4%<br />
$50,000-59,999 3,056 7.7% 3109 7.6% 3,123 7.6% 14 0.4%<br />
$60,000-74,999 4,428 11.2% 4159 10.2% 4,084 10.0% -69 -1.6%<br />
$75,000-99,999 4,426 11.2% 4353 10.7% 4,333 10.6% -19 -0.4%<br />
$100,000+ 7,954 20.2% 9883 24.3% 10,417 25.4% 492 6.2%<br />
Total 39,461 100.0% 40,647 100.0% 40,975 100.0%<br />
Source: Ribbon Demographics 2007, Novogradac & Company LLP, May 2012<br />
The largest income cohort was between 100,000 +. The Subject will target households earning<br />
below $45,000. However, the subject will operate with 100 percent subsidy, <strong>and</strong> will be<br />
replacement housing therefore we believe there to be adequate dem<strong>and</strong> for the subject proposed,<br />
despite the prevalence <strong>of</strong> high income households in the PMA.<br />
2d. Renter Households by Number <strong>of</strong> Persons in the Household<br />
The following table illustrates the number <strong>of</strong> persons per household among renter households.<br />
2000<br />
Renter Households by Number <strong>of</strong> Persons - PMA<br />
2010 Projected Mkt Entry June 2014 2015<br />
Number Percentage Number Percentage Number Percentage Number Percentage<br />
With 1 Person 7,513 42.6% 8,829 44.1% 9,341 44.8% 9,483 45.0%<br />
With 2 Persons 5,186 29.4% 5,630 28.1% 5,705 27.3% 5,726 27.1%<br />
With 3 Persons 2,247 12.7% 2,460 12.3% 2,518 12.1% 2,534 12.0%<br />
With 4 Persons 1,325 7.5% 1,568 7.8% 1,665 8.0% 1,692 8.0%<br />
With 5+ Persons 1,366 7.7% 1,540 7.7% 1,635 7.8% 1,661 7.9%<br />
Total Renter Households 17,637 100.0% 20,027 100.0% 20,864 100.0% 21,096 100.0%<br />
Source: Ribbon Demographics 2007, Novogradac & Company LLP, May 2012<br />
Among renters in the PMA 72.2 percent reside in one-person <strong>and</strong> two-person households. This<br />
bodes well for the subject’s proposed unit mix, as 55 <strong>of</strong> the total 71 proposed units are one or<br />
two-bedroom units.<br />
2e <strong>and</strong> f. Elderly <strong>and</strong> HFOP<br />
Per DCA’s guidelines, elderly households populations will be based on households who are 62<br />
years <strong>and</strong> older <strong>and</strong> HFOP populations will be based on households who are 55 years or older<br />
according to the census.<br />
CONCLUSION<br />
The total population <strong>and</strong> annual household growth in the PMA is <strong>project</strong>ed to grow over the next<br />
three years at a slightly lesser pace than the MSA <strong>and</strong> nation. Similar to population trends,<br />
annual household growth in the PMA is strong at 0.8 percent annually <strong>and</strong> estimated to increase<br />
by 0.8 percent by 2015, but does not surpass that <strong>of</strong> MSA but is right in line with the nation’s<br />
growth. The average household size is <strong>project</strong>ed to remain relatively stable over the next three<br />
years in all areas <strong>of</strong> analysis. The households within the PMA are split almost 50/50 between<br />
owner-occupied <strong>and</strong> renter-occupied residences however renter occupied residences are<br />
<strong>project</strong>ed to increase. Renter-occupied residences account for 50.75% which is a significantly<br />
higher percentage than the 13% that they account for in the nation. In addition, among renters in<br />
Novogradac & Company, LLP 31