The Best Beer Company in a Better World - Anheuser-Busch InBev
The Best Beer Company in a Better World - Anheuser-Busch InBev
The Best Beer Company in a Better World - Anheuser-Busch InBev

You also want an ePaper? Increase the reach of your titles
YUMPU automatically turns print PDFs into web optimized ePapers that Google loves.
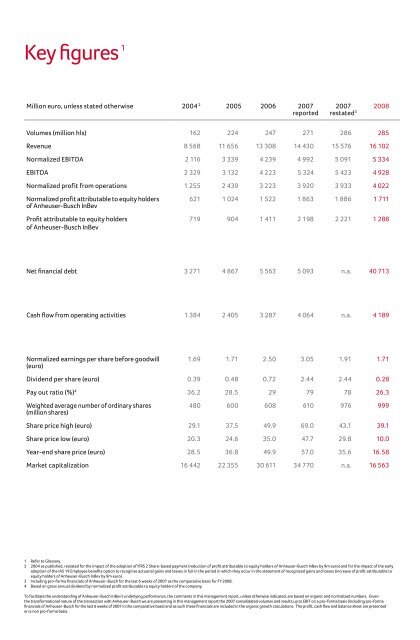
Key figures 1<br />
Million euro, unless stated otherwise 2004 2 2005 2006 2007<br />
reported<br />
04<br />
N<br />
50%<br />
40%<br />
30%<br />
20%<br />
10%<br />
04 05 06 07 07<br />
0%<br />
3 28.6%<br />
24.7%<br />
2008<br />
31.9% 34.6% 2<br />
32.7% 33.1%<br />
1<br />
1<br />
5<br />
04 05 06 07 07<br />
0<br />
3 Volumes (million hls) 162 224 247 271 286 285<br />
Revenue 8 568 11 656 13 308 14 430 15 576 16 102<br />
Normalized EBITDA 2 116 3 339 4 239 4 992 5 091 5 334<br />
EBITDA 2 329 3 132 4 223 5 324 5 423 4 928<br />
Normalized profit from operations<br />
Normalized profit attributable to equity holders<br />
of <strong>Anheuser</strong>-<strong>Busch</strong> <strong>InBev</strong><br />
1 255 2 439 3 223<br />
621 1 024 1 522<br />
3 920<br />
1 863<br />
3 933 4 02215<br />
576 16 102<br />
14 430<br />
13 308<br />
1 886 11 656 1 711<br />
8 568<br />
Profit attributable to equity holders<br />
of <strong>Anheuser</strong>-<strong>Busch</strong> <strong>InBev</strong><br />
719 904 1 411 2 198 2 221 1 288<br />
2008<br />
Normalized EBITDA<br />
Revenue<br />
Net f<strong>in</strong>ancial debt 3 271 4 867 5 563 5 093 n.a. 40 713<br />
Percentage<br />
2007<br />
restated 3<br />
Cash flow from operat<strong>in</strong>g activities 1 384 2 405 3 287 4 064 n.a. 4 189<br />
Normalized earn<strong>in</strong>gs per share before goodwill<br />
(euro)<br />
2008<br />
1.69 1.71 2.50 3.05 1.91 1.71<br />
Dividend per share (euro) 0.39 0.48 0.72 2.44 2.44 0.28<br />
Pay out ratio (%) 4 36.2 28.5 29 79 78 26.3<br />
Weighted average number of ord<strong>in</strong>ary shares<br />
(million shares)<br />
480 600 608 610 976 999<br />
Share price high (euro) 29.1 37.5 49.9 69.0 43.1 39.1<br />
Share price low (euro) 20.3 24.6 35.0 47.7 29.8 10.0<br />
Year-end share price (euro) 28.5 36.8 49.9 57.0 35.6 16.58<br />
Market capitalization 16 442 22 355 30 611 34 770 n.a. 16 563<br />
1 Refer to Glossary.<br />
2 2004 as published, restated for the impact of the adoption of IFRS 2 Share-based payment (reduction of profit attributable to equity holders of <strong>Anheuser</strong>-<strong>Busch</strong> <strong>InBev</strong> by 9m euro) and for the impact of the early<br />
adoption of the IAS 19 Employee benefits option to recognize actuarial ga<strong>in</strong>s and losses <strong>in</strong> full <strong>in</strong> the period <strong>in</strong> which they occur <strong>in</strong> the statement of recognized ga<strong>in</strong>s and losses (<strong>in</strong>crease of profit attributable to<br />
equity holders of <strong>Anheuser</strong>-<strong>Busch</strong> <strong>InBev</strong> by 9m euro).<br />
3 Includ<strong>in</strong>g pro-forma f<strong>in</strong>ancials of <strong>Anheuser</strong>-<strong>Busch</strong> for the last 6 weeks of 2007 as the comparative basis for FY 2008.<br />
4 Based on gross annual dividend by normalized profit attributable to equity holders of the company.<br />
To facilitate the understand<strong>in</strong>g of <strong>Anheuser</strong>-<strong>Busch</strong> <strong>InBev</strong>’s underly<strong>in</strong>g performance, the comments <strong>in</strong> this management report, unless otherwise <strong>in</strong>dicated, are based on organic and normalized numbers. Given<br />
the transformational nature of the transaction with <strong>Anheuser</strong>-<strong>Busch</strong> we are present<strong>in</strong>g <strong>in</strong> this management report the 2007 consolidated volumes and results up to EBIT on a pro-forma basis (<strong>in</strong>clud<strong>in</strong>g pro-forma<br />
f<strong>in</strong>ancials of <strong>Anheuser</strong>-<strong>Busch</strong> for the last 6 weeks of 2007 <strong>in</strong> the comparative base) and as such these f<strong>in</strong>ancials are <strong>in</strong>cluded <strong>in</strong> the organic growth calculations. <strong>The</strong> profit, cash flow and balance sheet are presented<br />
on a non pro-forma basis.<br />
24.7%