The Best Beer Company in a Better World - Anheuser-Busch InBev
The Best Beer Company in a Better World - Anheuser-Busch InBev
The Best Beer Company in a Better World - Anheuser-Busch InBev

You also want an ePaper? Increase the reach of your titles
YUMPU automatically turns print PDFs into web optimized ePapers that Google loves.
50%<br />
40%<br />
30%<br />
20%<br />
10%<br />
04 05 06 07 07<br />
0%<br />
3 28.6%<br />
24.7%<br />
2008<br />
31.9% 34.6% 20 000<br />
32.7% 33.1%<br />
15 000<br />
10 000<br />
5 000<br />
04 05 06 07 07<br />
0<br />
3 50%<br />
40%<br />
30%<br />
20%<br />
15 576 16 102<br />
14 430<br />
13 308<br />
11 656<br />
8 568<br />
10%<br />
0%<br />
04 05 06 07 07 2008<br />
3 28.6%<br />
24.7%<br />
2008<br />
31.9% 34.6% 20 000<br />
32.7% 33.1%<br />
15 000<br />
10 000<br />
5 000<br />
0<br />
04 05 06 07 073 50%<br />
40%<br />
30%<br />
15 576 16 102<br />
14 430<br />
13 308<br />
11 656<br />
8 568<br />
20%<br />
10%<br />
0%<br />
05 06 07 07<br />
2008<br />
3 28.6%<br />
2008<br />
31.9% 34.6% 32.7% 33.1%<br />
20 000<br />
15 000<br />
10 000<br />
5 000<br />
04<br />
0<br />
05 06 07 073 15 576 16 102<br />
14 430<br />
13 308<br />
11 656<br />
8 568<br />
2008<br />
Percentage<br />
Normalized Normalized EBITDA EBITDA<br />
ormalized EBITDA<br />
0 000<br />
5 000<br />
0 000<br />
000<br />
Million euro<br />
Percentage<br />
Brief overview<br />
Percentage<br />
Revenue Revenue<br />
Revenue<br />
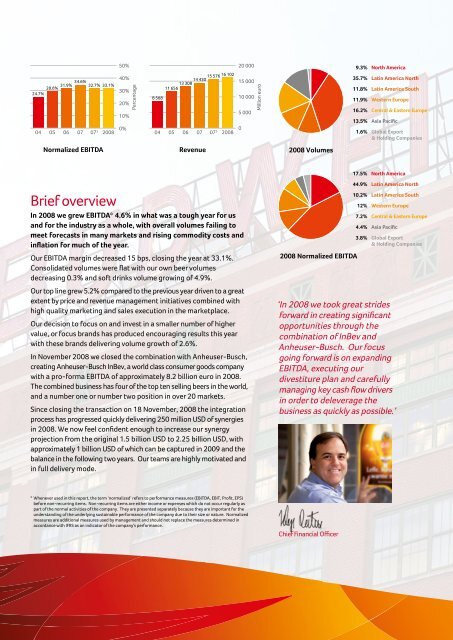
9.3% North America<br />
35.7% Lat<strong>in</strong> America North<br />
11.8% Lat<strong>in</strong> America South<br />
11.9% Western Europe<br />
In 2008 we grew EBITDA* 4.6% <strong>in</strong> 16.2% what Central was & a Eastern tough Europe year for us<br />
and for the <strong>in</strong>dustry as a whole, with 13.5% overall Asia Pacific volumes fail<strong>in</strong>g to<br />
meet forecasts <strong>in</strong> many markets and 1.6% ris<strong>in</strong>g Global Export commodity costs and<br />
<strong>in</strong>flation for much of the year.<br />
& Hold<strong>in</strong>g Companies<br />
Our EBITDA marg<strong>in</strong> 2008 Volumes decreased 15 bps, clos<strong>in</strong>g the year at 33.1%.<br />
Consolidated volumes were flat with our own beer volumes<br />
decreas<strong>in</strong>g 0.3% and soft dr<strong>in</strong>ks volume grow<strong>in</strong>g of 4.9%.<br />
Our top l<strong>in</strong>e grew 5.2% compared to the previous year driven to a great<br />
extent by price and revenue management <strong>in</strong>itiatives comb<strong>in</strong>ed with<br />
high quality market<strong>in</strong>g and sales execution <strong>in</strong> the marketplace.<br />
Our decision to focus on and <strong>in</strong>vest <strong>in</strong> a smaller number of higher<br />
value, or focus brands has produced encourag<strong>in</strong>g results this year<br />
with these brands deliver<strong>in</strong>g volume growth of 2.6%.<br />
In November 2008 we closed the comb<strong>in</strong>ation with <strong>Anheuser</strong>-<strong>Busch</strong>,<br />
creat<strong>in</strong>g <strong>Anheuser</strong>-<strong>Busch</strong> <strong>InBev</strong>, a world class consumer goods company<br />
with a pro-forma EBITDA of approximately 8.2 billion euro <strong>in</strong> 2008.<br />
<strong>The</strong> comb<strong>in</strong>ed bus<strong>in</strong>ess has four of the top ten sell<strong>in</strong>g beers <strong>in</strong> the world,<br />
and a number one or number two position <strong>in</strong> over 20 markets.<br />
S<strong>in</strong>ce clos<strong>in</strong>g the transaction on 18 November, 2008 the <strong>in</strong>tegration<br />
process has progressed quickly deliver<strong>in</strong>g 250 million USD of synergies<br />
<strong>in</strong> 2008. We now feel confident enough to <strong>in</strong>crease our synergy<br />
projection from the orig<strong>in</strong>al 1.5 billion USD to 2.25 billion USD, with<br />
approximately 1 billion USD of which can be captured <strong>in</strong> 2009 and the<br />
balance <strong>in</strong> the follow<strong>in</strong>g two years. Our teams are highly motivated and<br />
<strong>in</strong> full delivery mode.<br />
* Whenever used <strong>in</strong> this report, the term ‘normalized’ refers to performance measures (EBITDA, EBIT, Profit, EPS)<br />
before non-recurr<strong>in</strong>g items. Non-recurr<strong>in</strong>g items are either <strong>in</strong>come or expenses which do not occur regularly as<br />
part of the normal activities of the company. <strong>The</strong>y are presented separately because they are important for the<br />
understand<strong>in</strong>g of the underly<strong>in</strong>g susta<strong>in</strong>able performance of the company due to their size or nature. Normalized<br />
measures are additional measures used by management and should not replace the measures determ<strong>in</strong>ed <strong>in</strong><br />
accordance with IFRS as an <strong>in</strong>dicator of the company’s performance.<br />
Million euro<br />
Million euro<br />
Million euro<br />
2008 Volumes 2008 Volumes<br />
2008 Volumes<br />
2008 Normalized EBITDA<br />
‘In 2008 we took great strides<br />
forward <strong>in</strong> creat<strong>in</strong>g significant<br />
opportunities through the<br />
comb<strong>in</strong>ation of <strong>InBev</strong> and<br />
<strong>Anheuser</strong>-<strong>Busch</strong>. Our focus<br />
go<strong>in</strong>g forward is on expand<strong>in</strong>g<br />
EBITDA, execut<strong>in</strong>g our<br />
divestiture plan and carefully<br />
manag<strong>in</strong>g key cash flow drivers<br />
<strong>in</strong> order to deleverage the<br />
bus<strong>in</strong>ess as quickly as possible.’<br />
Chief F<strong>in</strong>ancial Officer<br />
9.3% North 9.3% America North America<br />
9.3% North America<br />
35.7% Lat<strong>in</strong> 35.7% America Lat<strong>in</strong> North America N<br />
35.7% Lat<strong>in</strong> America North<br />
11.8% Lat<strong>in</strong> 11.8% America Lat<strong>in</strong> South America So<br />
11.8% Lat<strong>in</strong> America South<br />
11.9% Western 11.9% Europe Western Europe<br />
11.9% Western Europe<br />
16.2% Central 16.2% & Central Eastern & Europe Eastern<br />
16.2% Central & Eastern Europe<br />
13.5% Asia 13.5% Pacific Asia Pacific<br />
13.5% Asia Pacific<br />
1.6% Global 1.6% Export Global Export<br />
1.6% Global Export & Hold<strong>in</strong>g & Companies Hold<strong>in</strong>g Comp<br />
& Hold<strong>in</strong>g Companies<br />
17.5% North America<br />
44.9% Lat<strong>in</strong> America North<br />
10.2% Lat<strong>in</strong> America South<br />
12% Western Europe<br />
7.2% Central & Eastern Europe<br />
4.4% Asia Pacific<br />
3.8% Global Export<br />
& Hold<strong>in</strong>g Companies