Notes to the consolidated financial statements - Efacec
Notes to the consolidated financial statements - Efacec
Notes to the consolidated financial statements - Efacec

You also want an ePaper? Increase the reach of your titles
YUMPU automatically turns print PDFs into web optimized ePapers that Google loves.
1.3 Reporting by segments<br />
A business segment is a group of activities and operations involved in <strong>the</strong> supply of products and services subject <strong>to</strong> risks and<br />
benefi ts that are different <strong>to</strong> o<strong>the</strong>r business segments. A geographical segment is involved in supplying products and services<br />
within a specifi c economic environment that is subject <strong>to</strong> different risks and benefi ts than those of segments that operate within<br />
o<strong>the</strong>r economic environments.<br />
1.4 Exchange rate conversion<br />
(a) Functional currency and for presentation purposes<br />
The fi gures included in <strong>the</strong> Financial Statements of each of <strong>the</strong> Group entities are stated using <strong>the</strong> currency of <strong>the</strong> country in<br />
which <strong>the</strong> unit operates (“The functional currency”). The <strong>consolidated</strong> Financial Statements are presented in Euro, this being <strong>the</strong><br />
functional and presentational currency of <strong>the</strong> Group accounts.<br />
(b) Transactions and Balances<br />
Transactions in currencies o<strong>the</strong>r than <strong>the</strong> Euro are converted <strong>to</strong> <strong>the</strong> functional currency using <strong>the</strong> exchange rate at <strong>the</strong> date of<br />
<strong>the</strong> transaction. Exchange gains and losses arising from <strong>the</strong> payment of transactions and from conversion at <strong>the</strong> rate on <strong>the</strong> balance<br />
sheet date of <strong>the</strong> assets and liabilities designated in a currency o<strong>the</strong>r than <strong>the</strong> Euro, are recognised in <strong>the</strong> Profi t and Loss<br />
Account.<br />
(c) Group Companies<br />
The fi nancial results and position of all Group entities (none of which use a currency of a country suffering hyper infl ation) that<br />
have a functional currency different <strong>to</strong> that of account presentation are converted <strong>to</strong> <strong>the</strong> presentation currency as follows:<br />
(I) The assets and liabilities of each balance sheet presented are converted at <strong>the</strong> exchange<br />
rate in force at <strong>the</strong> date of <strong>the</strong> Financial Statements;<br />
(II) Income and expenses of each Profi t and Loss Account are converted at <strong>the</strong> average<br />
exchange rate; and<br />
(III) The resulting exchange rate differences are shown in Shareholders’ Funds in <strong>the</strong> line<br />
Reserves.<br />
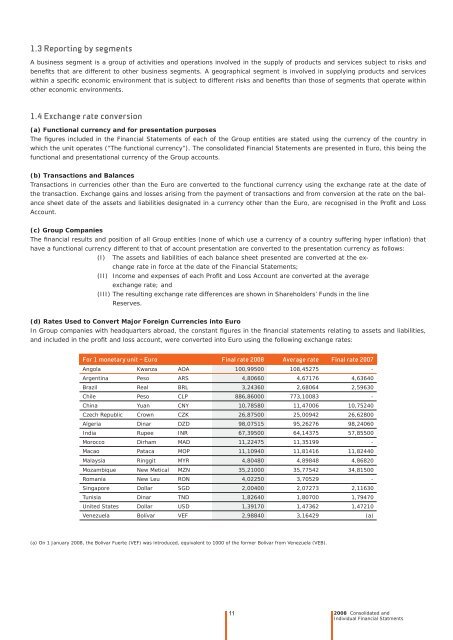
(d) Rates Used <strong>to</strong> Convert Major Foreign Currencies in<strong>to</strong> Euro<br />
In Group companies with headquarters abroad, <strong>the</strong> constant fi gures in <strong>the</strong> fi nancial <strong>statements</strong> relating <strong>to</strong> assets and liabilities,<br />
and included in <strong>the</strong> profi t and loss account, were converted in<strong>to</strong> Euro using <strong>the</strong> following exchange rates:<br />
For 1 monetary unit – Euro Final rate 2008 Average rate Final rate 2007<br />
Angola Kwanza AOA 100,99500 108,45275 -<br />
Argentina Peso ARS 4,80660 4,67176 4,63640<br />
Brazil Real BRL 3,24360 2,68064 2,59630<br />
Chile Peso CLP 886,86000 773,10083 -<br />
China Yuan CNY 10,78580 11,47006 10,75240<br />
Czech Republic Crown CZK 26,87500 25,00942 26,62800<br />
Algeria Dinar DZD 98,07515 95,26276 98,24060<br />
India Rupee INR 67,39500 64,14375 57,85500<br />
Morocco Dirham MAD 11,22475 11,35199 -<br />
Macao Pataca MOP 11,10940 11,81416 11,82440<br />
Malaysia Ringgit MYR 4,80480 4,89848 4,86820<br />
Mozambique New Metical MZN 35,21000 35,77542 34,81500<br />
Romania New Leu RON 4,02250 3,70529 -<br />
Singapore Dollar SGD 2,00400 2,07273 2,11630<br />
Tunisia Dinar TND 1,82640 1,80700 1,79470<br />
United States Dollar USD 1,39170 1,47362 1,47210<br />
Venezuela Bolívar VEF 2,98840 3,16429 (a)<br />
(a) On 1 January 2008, <strong>the</strong> Bolivar Fuerte (VEF) was introduced, equivalent <strong>to</strong> 1000 of <strong>the</strong> former Bolivar from Venezuela (VEB).<br />
11<br />
2008 Consolidated and<br />
Individual Financial Statments