Notes to the consolidated financial statements - Efacec
Notes to the consolidated financial statements - Efacec
Notes to the consolidated financial statements - Efacec

Create successful ePaper yourself
Turn your PDF publications into a flip-book with our unique Google optimized e-Paper software.
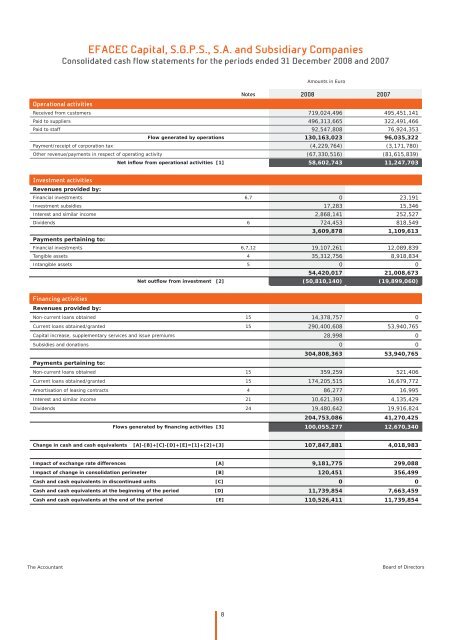
EFACEC Capital, S.G.P.S., S.A. and Subsidiary Companies<br />
Consolidated cash flow <strong>statements</strong> for <strong>the</strong> periods ended 31 December 2008 and 2007<br />
Operational activities<br />
The Accountant Board of Direc<strong>to</strong>rs<br />
8<br />
Amounts in Euro<br />
<strong>Notes</strong> 2008 2007<br />
Received from cus<strong>to</strong>mers 719,024,496 495,451,141<br />
Paid <strong>to</strong> suppliers 496,313,665 322,491,466<br />
Paid <strong>to</strong> staff 92,547,808 76,924,353<br />
Flow generated by operations 130,163,023 96,035,322<br />
Payment/receipt of corporation tax (4,229,764) (3,171,780)<br />
O<strong>the</strong>r revenue/payments in respect of operating activity (67,330,516) (81,615,839)<br />
Investment activities<br />
Revenues provided by:<br />
Net infl ow from operational activities [1] 58,602,743 11,247,703<br />
Financial investments 6,7 0 23,191<br />
Investment subsidies 17,283 15,346<br />
Interest and similar income 2,868,141 252,527<br />
Dividends 6 724,453 818,549<br />
Payments pertaining <strong>to</strong>:<br />
3,609,878 1,109,613<br />
Financial investments 6,7,12 19,107,261 12,089,839<br />
Tangible assets 4 35,312,756 8,918,834<br />
Intangible assets 5 0 0<br />
54,420,017 21,008,673<br />
Net outfl ow from investment [2] (50,810,140) (19,899,060)<br />
Financing activities<br />
Revenues provided by:<br />
Non-current loans obtained 15 14,378,757 0<br />
Current loans obtained/granted 15 290,400,608 53,940,765<br />
Capital increase, supplementary services and issue premiums 28,998 0<br />
Subsidies and donations 0 0<br />
Payments pertaining <strong>to</strong>:<br />
304,808,363 53,940,765<br />
Non-current loans obtained 15 359,259 521,406<br />
Current loans obtained/granted 15 174,205,515 16,679,772<br />
Amortisation of leasing contracts 4 86,277 16,995<br />
Interest and similar income 21 10,621,393 4,135,429<br />
Dividends 24 19,480,642 19,916,824<br />
204,753,086 41,270,425<br />
Flows generated by fi nancing activities [3] 100,055,277 12,670,340<br />
Change in cash and cash equivalents [A]-[B]+[C]-[D]+[E]=[1]+[2]+[3] 107,847,881 4,018,983<br />
Impact of exchange rate differences [A] 9,181,775 299,088<br />
Impact of change in consolidation perimeter [B] 120,451 356,499<br />
Cash and cash equivalents in discontinued units [C] 0 0<br />
Cash and cash equivalents at <strong>the</strong> beginning of <strong>the</strong> period [D] 11,739,854 7,663,459<br />
Cash and cash equivalents at <strong>the</strong> end of <strong>the</strong> period [E] 110,526,411 11,739,854