Particle Physics Booklet - Particle Data Group - Lawrence Berkeley ...
Particle Physics Booklet - Particle Data Group - Lawrence Berkeley ...
Particle Physics Booklet - Particle Data Group - Lawrence Berkeley ...

Create successful ePaper yourself
Turn your PDF publications into a flip-book with our unique Google optimized e-Paper software.
9. Quantum chromodynamics 171<br />
at all. For these reasons, in determinations of the coupling, it has become<br />
standard practice to quote the value of αs at a given scale (typically MZ) rather than to quote a value for Λ.<br />
The value of the coupling, as well as the exact forms of the b2, c10 (and<br />
higher order) coefficients, depend on the renormalization scheme in which<br />
the coupling is defined, i.e. the convention used to subtract infinities in<br />
the context of renormalization. The coefficients given above hold for a<br />
coupling defined in the modified minimal subtraction (MS) scheme [14],<br />
by far the most widely used scheme.<br />
9.3.4. Measurements of the strong coupling constant : For this<br />
review it was decided to quote a recent analysis by Bethke [172], which<br />
incorporates results with recently improved theoretical predictions and/or<br />
experimental precision. The central value is determined as the weighted<br />
average of the individual measurements. For the error an overall, a-priori<br />
unknown, correlation coefficient is introduced and determined by requiring<br />
that the total χ2 of the combination equals the number of degrees of<br />
freedom. The world average quoted in Ref. 172 is<br />
αs(M 2 Z )=0.1184 ± 0.0007 .<br />
It is worth noting that a cross check performed in Ref. 172, consisting in<br />
excluding each of the single measurements from the combination, resulted<br />
in variations of the central value well below the quoted uncertainty,<br />
andinamaximalincreaseofthecombinederrorupto0.0012. Most<br />
notably, excluding the most precise determination from lattice QCD gives<br />
only a marginally different average value. Nevertheless, there remains an<br />
apparent and long-standing systematic difference between the results from<br />
structure functions and other determinations of similar accuracy. This is<br />
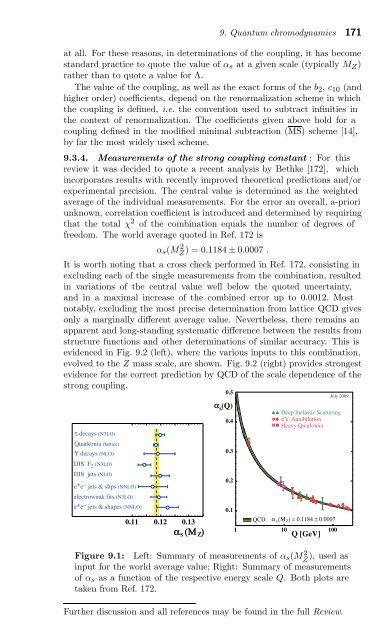
evidenced in Fig. 9.2 (left), where the various inputs to this combination,<br />
evolved to the Z mass scale, are shown. Fig. 9.2 (right) provides strongest<br />
evidence for the correct prediction by QCD of the scale dependence of the<br />
strong coupling.<br />
τ-decays (N3LO)<br />
Quarkonia (lattice)<br />
Υ decays (NLO)<br />
DIS F 2 (N3LO)<br />
DIS jets (NLO)<br />
e + e – jets & shps (NNLO)<br />
electroweak fits (N3LO)<br />
e + e – jets & shapes (NNLO)<br />
0.11 0.12 0.13<br />
α (Μ )<br />
s Z<br />
0.5<br />
α s (Q)<br />
0.4<br />
0.3<br />
0.2<br />
0.1<br />
e<br />
Heavy Quarkonia<br />
+ e – Deep Inelastic Scattering<br />
Annihilation<br />
QCD α (Μ ) = 0.1184 ± 0.0007<br />
s Z<br />
1 10 100<br />
Q [GeV]<br />
July 2009<br />
Figure 9.1: Left: Summary of measurements of αs(M 2 Z ), used as<br />
input for the world average value; Right: Summary of measurements<br />
of αs as a function of the respective energy scale Q. Both plots are<br />
taken from Ref. 172.<br />
Further discussion and all references may be found in the full Review.