Particle Physics Booklet - Particle Data Group - Lawrence Berkeley ...
Particle Physics Booklet - Particle Data Group - Lawrence Berkeley ...
Particle Physics Booklet - Particle Data Group - Lawrence Berkeley ...

Create successful ePaper yourself
Turn your PDF publications into a flip-book with our unique Google optimized e-Paper software.
186 11. The CKM quark-mixing matrix<br />
1.5<br />
η<br />
1.0<br />
0.5<br />
0.0<br />
-0.5<br />
-1.0<br />
excluded area has CL > 0.95<br />
sin 2β<br />
εK<br />
α<br />
γ<br />
Vub<br />
γ<br />
α<br />
γ<br />
excluded at CL > 0.95<br />
ρ<br />
β<br />
α<br />
Δmd<br />
& Δms<br />
Δmd<br />
εK<br />
sol. w/ cos 2β<br />
< 0<br />
(excl. at CL > 0.95)<br />
-1.5<br />
-1.0 -0.5 0.0 0.5 1.0 1.5 2.0<br />
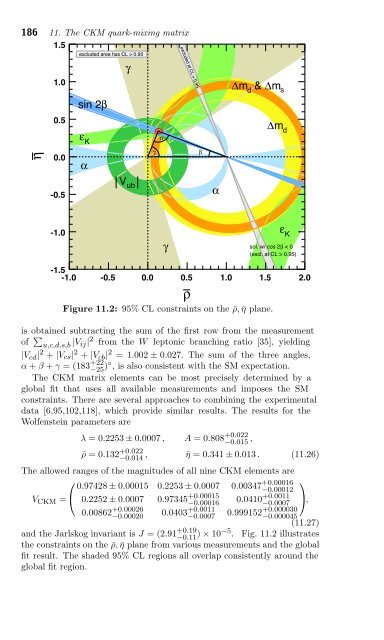
Figure 11.2: 95% CL constraints on the ¯ρ, ¯η plane.<br />
is obtained subtracting the sum of the first row from the measurement<br />
of �<br />
u,c,d,s,b |Vij| 2 from the W leptonic branching ratio [35], yielding<br />
|Vcd| 2 + |Vcs| 2 + |Vcb| 2 =1.002 ± 0.027. The sum of the three angles,<br />
α + β + γ = (183 +22<br />
−25 )◦ , is also consistent with the SM expectation.<br />
The CKM matrix elements can be most precisely determined by a<br />
global fit that uses all available measurements and imposes the SM<br />
constraints. There are several approaches to combining the experimental<br />
data [6,95,102,118], which provide similar results. The results for the<br />
Wolfenstein parameters are<br />
λ =0.2253 ± 0.0007 , A =0.808 +0.022<br />
−0.015 ,<br />
¯ρ =0.132 +0.022<br />
−0.014 , ¯η =0.341 ± 0.013 . (11.26)<br />
The allowed ranges of the magnitudes of all nine CKM elements are<br />
⎛<br />
0.97428 ± 0.00015 0.2253 ± 0.0007 0.00347<br />
VCKM = ⎝<br />
+0.00016<br />
−0.00012<br />
0.2252 ± 0.0007 0.97345 +0.00015<br />
−0.00016 0.0410 +0.0011<br />
−0.0007<br />
0.00862 +0.00026<br />
−0.00020 0.0403 +0.0011<br />
−0.0007 0.999152 +0.000030<br />
⎞<br />
⎠,<br />
−0.000045<br />
(11.27)<br />
and the Jarlskog invariant is J =(2.91 +0.19<br />
−0.11 ) × 10−5 . Fig. 11.2 illustrates<br />
the constraints on the ¯ρ, ¯η plane from various measurements and the global<br />
fit result. The shaded 95% CL regions all overlap consistently around the<br />
global fit region.