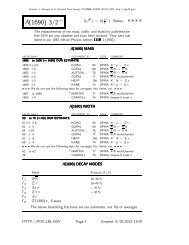
Particle Physics Booklet - Particle Data Group - Lawrence Berkeley ...
Particle Physics Booklet - Particle Data Group - Lawrence Berkeley ...
Particle Physics Booklet - Particle Data Group - Lawrence Berkeley ...

Create successful ePaper yourself
Turn your PDF publications into a flip-book with our unique Google optimized e-Paper software.
282 33. Statistics<br />
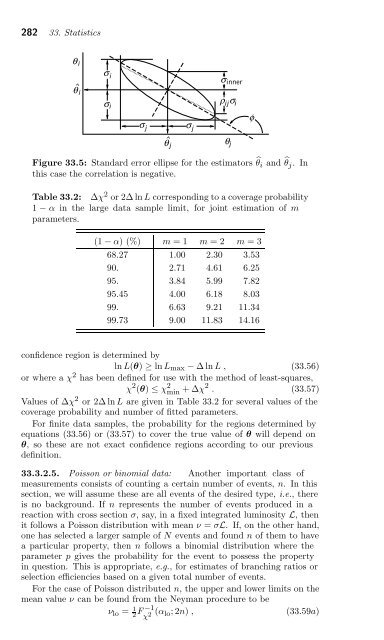
θ i<br />
^<br />
θ i<br />
σi<br />
σi<br />
σj<br />
^<br />
θ j<br />
σj<br />
σinner<br />
ρ ij σi<br />
Figure 33.5: Standard error ellipse for the estimators � θi and � θj. In<br />
this case the correlation is negative.<br />
Table 33.2: Δχ 2 or 2Δ ln L corresponding to a coverage probability<br />
1 − α in the large data sample limit, for joint estimation of m<br />
parameters.<br />
(1 − α) (%) m =1 m =2 m =3<br />
68.27 1.00 2.30 3.53<br />
90. 2.71 4.61 6.25<br />
95. 3.84 5.99 7.82<br />
95.45 4.00 6.18 8.03<br />
99. 6.63 9.21 11.34<br />
99.73 9.00 11.83 14.16<br />
confidence region is determined by<br />
ln L(θ) ≥ ln Lmax − ΔlnL, (33.56)<br />
or where a χ 2 has been defined for use with the method of least-squares,<br />
χ 2 (θ) ≤ χ 2 min +Δχ2 . (33.57)<br />
Values of Δχ 2 or 2Δ ln L are given in Table 33.2 for several values of the<br />
coverage probability and number of fitted parameters.<br />
For finite data samples, the probability for the regions determined by<br />
equations (33.56) or (33.57) to cover the true value of θ will depend on<br />
θ, so these are not exact confidence regions according to our previous<br />
definition.<br />
33.3.2.5. Poisson or binomial data: Another important class of<br />
measurements consists of counting a certain number of events, n. In this<br />
section, we will assume these are all events of the desired type, i.e., there<br />
is no background. If n represents the number of events produced in a<br />
reaction with cross section σ, say, in a fixed integrated luminosity L, then<br />
it follows a Poisson distribution with mean ν = σL. If, on the other hand,<br />
one has selected a larger sample of N events and found n of them to have<br />
a particular property, then n follows a binomial distribution where the<br />
parameter p gives the probability for the event to possess the property<br />
in question. This is appropriate, e.g., for estimates of branching ratios or<br />
selection efficiencies based on a given total number of events.<br />
For the case of Poisson distributed n, the upper and lower limits on the<br />
mean value ν can be found from the Neyman procedure to be<br />
ν lo = 1 2<br />
θ j<br />
F −1<br />
χ 2 (α lo;2n) , (33.59a)<br />
φ