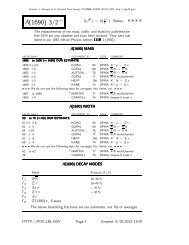
Particle Physics Booklet - Particle Data Group - Lawrence Berkeley ...
Particle Physics Booklet - Particle Data Group - Lawrence Berkeley ...
Particle Physics Booklet - Particle Data Group - Lawrence Berkeley ...

You also want an ePaper? Increase the reach of your titles
YUMPU automatically turns print PDFs into web optimized ePapers that Google loves.
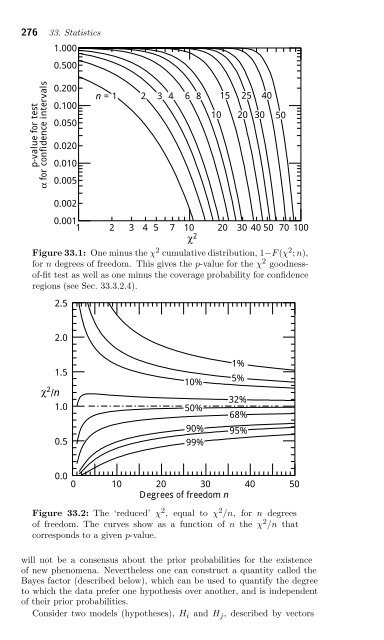
276 33. Statistics<br />
p-value for test<br />
α for confidence intervals<br />
1.000<br />
0.500<br />
0.200<br />
0.100<br />
0.050<br />
0.020<br />
0.010<br />
0.005<br />
0.002<br />
n = 1<br />
2 3 4 6 8<br />
0.001<br />
1 2 3 4 5 7 10<br />
χ<br />
20 30 40 50 70 100<br />
2<br />
Figure 33.1: One minus the χ 2 cumulative distribution, 1−F (χ 2 ; n),<br />
for n degrees of freedom. This gives the p-value for the χ 2 goodnessof-fit<br />
test as well as one minus the coverage probability for confidence<br />
regions (see Sec. 33.3.2.4).<br />
χ 2 /n<br />
2.5<br />
2.0<br />
1.5<br />
1.0<br />
0.5<br />
10%<br />
50%<br />
90%<br />
99%<br />
0.0<br />
0 10 20 30 40 50<br />
Degrees of freedom n<br />
10<br />
15<br />
25<br />
20<br />
32%<br />
68%<br />
95%<br />
Figure 33.2: The ‘reduced’ χ 2 , equal to χ 2 /n, for n degrees<br />
of freedom. The curves show as a function of n the χ 2 /n that<br />
corresponds to a given p-value.<br />
will not be a consensus about the prior probabilities for the existence<br />
of new phenomena. Nevertheless one can construct a quantity called the<br />
Bayes factor (described below), which can be used to quantify the degree<br />
to which the data prefer one hypothesis over another, and is independent<br />
of their prior probabilities.<br />
Consider two models (hypotheses), Hi and Hj, described by vectors<br />
1%<br />
5%<br />
30<br />
40<br />
50