Particle Physics Booklet - Particle Data Group - Lawrence Berkeley ...
Particle Physics Booklet - Particle Data Group - Lawrence Berkeley ...
Particle Physics Booklet - Particle Data Group - Lawrence Berkeley ...

You also want an ePaper? Increase the reach of your titles
YUMPU automatically turns print PDFs into web optimized ePapers that Google loves.
290 40. Kinematics<br />
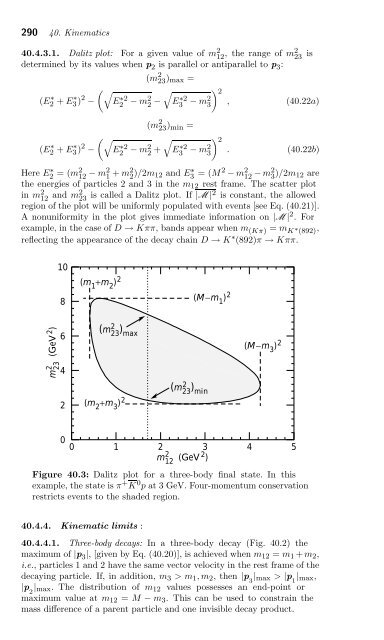
40.4.3.1. Dalitz plot: For a given value of m2 12 , the range of m223 is<br />
determined by its values when p2 is parallel or antiparallel to p3: (m 2 23 )max =<br />
(E ∗ 2 + E∗ 3 )2 ��<br />
− E∗2 2 − m2 2 −<br />
�<br />
E∗2 3 − m2 �2 3 , (40.22a)<br />
(m 2 23 )min =<br />
(E ∗ 2 + E∗ 3 )2 ��<br />
− E∗2 2 − m2 2 +<br />
�<br />
E∗2 3 − m2 �2 3 . (40.22b)<br />
Here E ∗ 2 =(m2 12 − m2 1 + m2 2 )/2m12 and E ∗ 3 =(M 2 − m 2 12 − m2 3 )/2m12 are<br />
the energies of particles 2 and 3 in the m12 rest frame. The scatter plot<br />
in m 2 12 and m2 23 is called a Dalitz plot. If |M |2 is constant, the allowed<br />
region of the plot will be uniformly populated with events [see Eq. (40.21)].<br />
A nonuniformity in the plot gives immediate information on |M | 2 .For<br />
example, in the case of D → Kππ, bands appear when m (Kπ) = m K ∗ (892) ,<br />
reflecting the appearance of the decay chain D → K ∗ (892)π → Kππ.<br />
m23 (GeV2 2<br />
)<br />
10<br />
8<br />
6<br />
4<br />
2<br />
(m 1 +m 2 ) 2<br />
(m2 23 ) max<br />
(m 2 +m 3 ) 2<br />
(m2 23 ) min<br />
(M−m 1 ) 2<br />
(M−m 3 ) 2<br />
0<br />
0 1 2 3 4 5<br />
m12 (GeV2 2 )<br />
Figure 40.3: Dalitz plot for a three-body final state. In this<br />
example, the state is π + K 0 p at 3 GeV. Four-momentum conservation<br />
restricts events to the shaded region.<br />
40.4.4. Kinematic limits :<br />
40.4.4.1. Three-body decays: In a three-body decay (Fig. 40.2) the<br />
maximum of |p 3 |,[givenbyEq.(40.20)], is achieved when m12 = m1 + m2,<br />
i.e., particles 1 and 2 have the same vector velocity in the rest frame of the<br />
decaying particle. If, in addition, m3 >m1,m2, then|p 3 |max > |p 1 |max,<br />
|p 2 |max. The distribution of m12 values possesses an end-point or<br />
maximum value at m12 = M − m3. This can be used to constrain the<br />
mass difference of a parent particle and one invisible decay product.