- Page 1 and 2:
Guide to STN Patent Databases Basic
- Page 3 and 4:
Preface Guide to STN Patent Databas
- Page 5 and 6:
Guide to STN Patent Databases 8 IFI
- Page 7 and 8:
Guide to STN Patent Databases 21.5
- Page 9:
Guide to STN Patent Databases 38.6
- Page 12 and 13:
12 Guide to STN Patent Databases 1
- Page 14 and 15:
14 Guide to STN Patent Databases 2
- Page 16 and 17:
16 Guide to STN Patent Databases 3.
- Page 18 and 19:
18 Guide to STN Patent Databases 3.
- Page 20 and 21:
20 Guide to STN Patent Databases 3.
- Page 22 and 23:
22 Guide to STN Patent Databases 3.
- Page 24 and 25:
24 Guide to STN Patent Databases 4
- Page 26 and 27:
26 1st publication 2nd publication
- Page 28 and 29:
28 Guide to STN Patent Databases EC
- Page 30 and 31:
30 Guide to STN Patent Databases EC
- Page 32 and 33:
32 Guide to STN Patent Databases 6
- Page 34 and 35:
34 Guide to STN Patent Databases Co
- Page 36 and 37:
6.4 Dynamics 36 Guide to STN Patent
- Page 38 and 39:
38 Guide to STN Patent Databases TE
- Page 40 and 41:
7 EPFULL 7.1 Typical queries 40 Gui
- Page 42 and 43:
42 controlling of electrical conduc
- Page 44 and 45:
44 Guide to STN Patent Databases Du
- Page 46 and 47:
46 Guide to STN Patent Databases ..
- Page 48 and 49:
48 Guide to STN Patent Databases De
- Page 50 and 51:
8.6.2 Granted Patent Display format
- Page 52 and 53:
52 Guide to STN Patent Databases US
- Page 54 and 55:
9.3 Contents 54 Guide to STN Patent
- Page 56 and 57:
56 Guide to STN Patent Databases Di
- Page 58 and 59:
58 Guide to STN Patent Databases Pa
- Page 60 and 61:
60 FAM2: Table PRAI PI, AI PI CFAM:
- Page 62 and 63:
9.8 When to use which database 62 G
- Page 64 and 65:
10.6 Documents from JAPIO 10.6.1 PA
- Page 66 and 67:
11 PATDPA 11.1 Typical queries 66 G
- Page 68 and 69:
68 Abstract, main claim: Guide to S
- Page 70 and 71:
70 Guide to STN Patent Databases 20
- Page 72 and 73:
12 PATDPAFULL 12.1 Typical queries
- Page 74 and 75:
74 Guide to STN Patent Databases da
- Page 76 and 77:
76 Guide to STN Patent Databases 8.
- Page 78 and 79:
78 Guide to STN Patent Databases De
- Page 80 and 81:
80 Guide to STN Patent Databases Se
- Page 82 and 83:
82 Guide to STN Patent Databases Pa
- Page 84 and 85:
15 USPATFULL / USPAT2 15.1 Typical
- Page 86 and 87:
86 Guide to STN Patent Databases RA
- Page 88 and 89:
88 Guide to STN Patent Databases RA
- Page 90 and 91:
16 Search by subject 90 Guide to ST
- Page 92 and 93:
17.2 Contents of the Basic Index 92
- Page 94 and 95:
94 Guide to STN Patent Databases lo
- Page 96 and 97:
96 Guide to STN Patent Databases 13
- Page 98 and 99:
98 Guide to STN Patent Databases =>
- Page 100 and 101:
100 E2 1 IN-HOUSE/TT E3 1626 1 -->
- Page 102 and 103:
102 Guide to STN Patent Databases T
- Page 104 and 105:
104 Guide to STN Patent Databases D
- Page 106 and 107:
A printed IPC code is according to
- Page 108 and 109:
108 Guide to STN Patent Databases F
- Page 110 and 111:
18.3.4 Search Strategy 110 Guide to
- Page 112 and 113:
112 Guide to STN Patent Databases H
- Page 114 and 115:
114 E8 5002 Y02C0010:08/ICO E9 1330
- Page 116 and 117:
19 Search by name 116 Guide to STN
- Page 118 and 119:
118 Guide to STN Patent Databases M
- Page 120 and 121:
19.5.2 Patent assignee 120 Guide to
- Page 122 and 123:
122 Guide to STN Patent Databases S
- Page 124 and 125:
124 /INA, /PAA , /AGA, /OPA, /OPAGA
- Page 126 and 127:
126 Guide to STN Patent Databases =
- Page 128 and 129:
128 Guide to STN Patent Databases 2
- Page 130 and 131:
130 => S RW IT/DS L18 881330 RW IT/
- Page 132 and 133:
132 Guide to STN Patent Databases S
- Page 134 and 135:
134 Guide to STN Patent Databases F
- Page 136 and 137:
136 Guide to STN Patent Databases D
- Page 138 and 139:
138 Guide to STN Patent Databases D
- Page 140 and 141:
140 Guide to STN Patent Databases I
- Page 142 and 143:
142 Guide to STN Patent Databases .
- Page 144 and 145:
144 Guide to STN Patent Databases D
- Page 146 and 147: 146 Guide to STN Patent Databases H
- Page 148 and 149: 21.5.3 INPADOCDB and INPAFAMDB 148
- Page 150 and 151: 150 Guide to STN Patent Databases F
- Page 152 and 153: 152 Guide to STN Patent Databases 2
- Page 154 and 155: 21.5.5 Chemical Abstracts Plus 154
- Page 156 and 157: 156 Guide to STN Patent Databases 2
- Page 158 and 159: 158 Part priorities Claiming an int
- Page 160 and 161: 22 Legal status search 160 Guide to
- Page 162 and 163: 162 Guide to STN Patent Databases W
- Page 164 and 165: 164 Guide to STN Patent Databases L
- Page 166 and 167: 22.2.1 Notes on /UPLS and /EDLS 166
- Page 168 and 169: 168 Guide to STN Patent Databases P
- Page 170 and 171: 170 Guide to STN Patent Databases S
- Page 172 and 173: 172 Guide to STN Patent Databases 2
- Page 174 and 175: 174 Guide to STN Patent Databases =
- Page 176 and 177: 24.4 RDISCLOSURE 176 Guide to STN P
- Page 178 and 179: 25.2 Accessing the full text 178 Gu
- Page 180 and 181: 26 Patent statistics 26.1 Introduct
- Page 182 and 183: 182 Guide to STN Patent Databases E
- Page 184 and 185: 184 268 2 2 0.73 FR 307 2 1 0.37 JP
- Page 186 and 187: 186 Guide to STN Patent Databases E
- Page 188 and 189: 188 Guide to STN Patent Databases P
- Page 190 and 191: Procedure: 190 Copy to Excel (Selec
- Page 192 and 193: 192 Guide to STN Patent Databases C
- Page 194 and 195: 194 Guide to STN Patent Databases -
- Page 198 and 199: 26.7.1.2 Cost 198 Guide to STN Pate
- Page 200 and 201: 27 Monitoring patents 27.1 Introduc
- Page 202 and 203: 202 Set the frequency of SDI runs S
- Page 204 and 205: 204 Guide to STN Patent Databases A
- Page 206 and 207: 206 Guide to STN Patent Databases C
- Page 208 and 209: More information on updates can be
- Page 210 and 211: 210 Guide to STN Patent Databases W
- Page 212 and 213: 212 Guide to STN Patent Databases D
- Page 214 and 215: 214 Guide to STN Patent Databases F
- Page 216 and 217: 216 Guide to STN Patent Databases E
- Page 218 and 219: 218 Guide to STN Patent Databases V
- Page 221 and 222: Search examples 221
- Page 223 and 224: Search examples 28.1.3 Linking clas
- Page 225 and 226: => S L1 AND L2 L16 471 L1 AND L2 =>
- Page 227 and 228: Search examples 28.1.6.1 Command fi
- Page 229 and 230: => s _res1-_res4\> _res 28.1.7.2 Se
- Page 231 and 232: Search examples L18 ANSWER 14 OF 55
- Page 233 and 234: Search examples DEF AUDIO/VISUAL RE
- Page 235 and 236: Search examples HOW MANY MORE ANSWE
- Page 237 and 238: Search examples ADVANCED VALID FROM
- Page 239 and 240: Search examples 2. EXPAND with rele
- Page 241 and 242: Search examples COPYRIGHT (c) 2006
- Page 243 and 244: E8 1 ADAMEK WOLFGANG ING/IN E9 1 AD
- Page 245 and 246: Search examples 31 Search by name (
- Page 247 and 248:
Search examples L9 ANSWER 2 OF 67 W
- Page 249 and 250:
Search examples L3 56 ("BUCKEYE CEL
- Page 251 and 252:
Search examples HAARMANN & REIMBER
- Page 253 and 254:
Search examples E5 6 RT1 DRAGOCO GE
- Page 255 and 256:
Search examples IN Chandhok, Ravind
- Page 257 and 258:
Search examples FILE 'INPADOCDB' EN
- Page 259 and 260:
Search examples einen weiteren Temp
- Page 261 and 262:
Search examples FILE 'USPATFULL' EN
- Page 263 and 264:
Search examples 33 Legal status sea
- Page 265 and 266:
Search examples DE 1997-19730759 A
- Page 267 and 268:
=> D BIB NTE Search examples DISPLA
- Page 269 and 270:
Search examples 33.2.1 Search in IN
- Page 271 and 272:
Search examples 20071022 ORE Opposi
- Page 273 and 274:
Search examples LI 0100 20030825 Ex
- Page 275 and 276:
34.1.2 Example 2 Search examples To
- Page 277 and 278:
34.1.3.1 1st Example Search example
- Page 279 and 280:
PRAI; TI ----------- MEMBER 5 -----
- Page 281 and 282:
Search examples DAV 20070823 unexam
- Page 283 and 284:
Search examples 20070816 DE8130 - W
- Page 285 and 286:
Search examples PAS SIEMENS MEDICAL
- Page 287 and 288:
Search examples PATENT NO. KIND DAT
- Page 289 and 290:
Search examples Some documents have
- Page 291 and 292:
SET SMARTSELECT OFF SET COMMAND COM
- Page 293 and 294:
Search examples L5 ANSWER 3 OF 123
- Page 295 and 296:
Search examples => FIL PATDPAFULL,
- Page 297 and 298:
Search examples HCAPLUS 1 BIOLIX/PA
- Page 299 and 300:
FILE 'IMSPATENTS' 0 COLGATE/PA 0 PA
- Page 301 and 302:
27 PALMOLIVE/PA 27 (COLGATE (S) PAL
- Page 303 and 304:
Search examples PI DE 9410153 U1 19
- Page 305 and 306:
Search examples JP 2001513628 T 200
- Page 307 and 308:
Surveys 307
- Page 309 and 310:
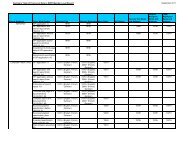
Surveys Code Country Land CAPLUS IN
- Page 311 and 312:
Surveys 37 INPADOCDB/INPAFAMDB Numb
- Page 313 and 314:
38 Asian Publications Surveys Asian
- Page 315 and 316:
38.3 DWPI China India Japan Korea F
- Page 317 and 318:
38.5.2 Conclusion Surveys Japan was
- Page 319 and 320:
Type of publication Printed publica
- Page 321 and 322:
Type of publication Printed publica