

Max Planck Institute for Astronomy - Annual Report 2005
Max Planck Institute for Astronomy - Annual Report 2005
Max Planck Institute for Astronomy - Annual Report 2005

You also want an ePaper? Increase the reach of your titles
YUMPU automatically turns print PDFs into web optimized ePapers that Google loves.
60 ly<br />
Fig. II.5.3: Temperature distribution in the model of a homogeneous<br />
torus. In the innermost region more than 1000 Kelvin are<br />
reached (orange). Towards the outside the temperature decreases<br />
continuously to about 100 Kelvin (dark red).<br />
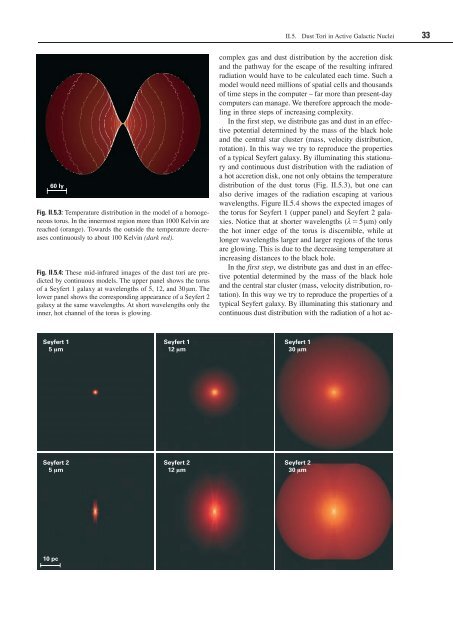
Fig. II.5.4: These mid-infrared images of the dust tori are predicted<br />
by continuous models. The upper panel shows the torus<br />
of a Seyfert 1 galaxy at wavelengths of 5, 12, and 30 �m. The<br />
lower panel shows the corresponding appearance of a Seyfert 2<br />
galaxy at the same wavelengths. At short wavelengths only the<br />
inner, hot channel of the torus is glowing.<br />
Seyfert 1<br />
5 �m<br />
Seyfert 2<br />
5 �m<br />
10 pc<br />
Seyfert 1<br />
12 �m<br />
Seyfert 2<br />
12 �m<br />
II.5. Dust Tori in Active Galactic Nuclei 33<br />
complex gas and dust distribution by the accretion disk<br />
and the pathway <strong>for</strong> the escape of the resulting infrared<br />
radiation would have to be calculated each time. Such a<br />
model would need millions of spatial cells and thousands<br />
of time steps in the computer – far more than present-day<br />
computers can manage. We there<strong>for</strong>e approach the modeling<br />
in three steps of increasing complexity.<br />
In the first step, we distribute gas and dust in an effective<br />
potential determined by the mass of the black hole<br />
and the central star cluster (mass, velocity distribution,<br />
rotation). In this way we try to reproduce the properties<br />
of a typical Seyfert galaxy. By illuminating this stationary<br />
and continuous dust distribution with the radiation of<br />
a hot accretion disk, one not only obtains the temperature<br />
distribution of the dust torus (Fig. II.5.3), but one can<br />
also derive images of the radiation escaping at various<br />
wavelengths. Figure II.5.4 shows the expected images of<br />
the torus <strong>for</strong> Seyfert 1 (upper panel) and Seyfert 2 galaxies.<br />
Notice that at shorter wavelengths (λ � 5 �m) only<br />
the hot inner edge of the torus is discernible, while at<br />
longer wavelengths larger and larger regions of the torus<br />
are glowing. This is due to the decreasing temperature at<br />
increasing distances to the black hole.<br />
In the first step, we distribute gas and dust in an effective<br />
potential determined by the mass of the black hole<br />
and the central star cluster (mass, velocity distribution, rotation).<br />
In this way we try to reproduce the properties of a<br />
typical Seyfert galaxy. By illuminating this stationary and<br />
continuous dust distribution with the radiation of a hot ac-<br />
Seyfert 1<br />
30 �m<br />
Seyfert 2<br />
30 �m


