

Max Planck Institute for Astronomy - Annual Report 2005
Max Planck Institute for Astronomy - Annual Report 2005
Max Planck Institute for Astronomy - Annual Report 2005

Create successful ePaper yourself
Turn your PDF publications into a flip-book with our unique Google optimized e-Paper software.
46<br />
II.8 Dynamics, Dust, and Young Stars<br />
Computer Simulations of Merging Galaxies<br />
During close encounters or collisions of galaxies huge<br />
tidal <strong>for</strong>ces occur that whirl up and compress the dust<br />
and gas in the galaxies. This induces a steep increase<br />
of star <strong>for</strong>mation in dense dust filaments that absorb a<br />
major part of the galaxy light. In some nearby galaxy<br />
pairs this process can be studied in detail. In distant<br />
stellar systems, however, this is impossible. Here, one<br />
has to infer the star <strong>for</strong>mation rate from luminosities in<br />
certain wavelengths ranges averaged over the entire<br />
galaxy. With the help of extensive computer simulations,<br />
a theorist at MPIA and her colleagues showed how<br />
the star <strong>for</strong>mation rate, dust absorption, and observed<br />
appearance of the galaxy change during a merger. They<br />
derived an analytical <strong>for</strong>mula based on the simulations,<br />
which can be used to predict the dust absorption. These<br />
results will considerably improve galaxy evolution<br />
models.<br />
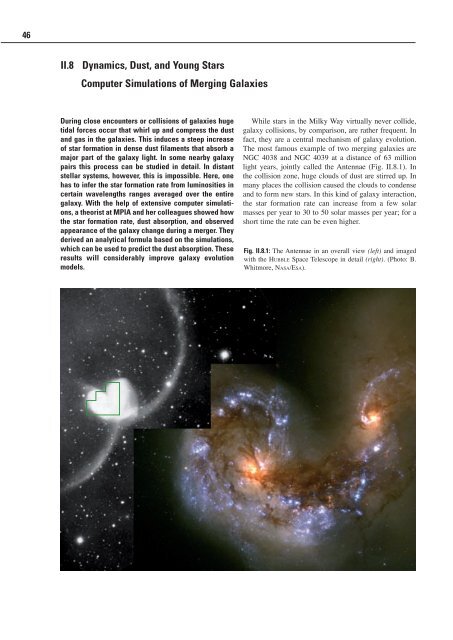
While stars in the Milky Way virtually never collide,<br />
galaxy collisions, by comparison, are rather frequent. In<br />
fact, they are a central mechanism of galaxy evolution.<br />
The most famous example of two merging galaxies are<br />
NGC 4038 and NGC 4039 at a distance of 63 million<br />
light years, jointly called the Antennae (Fig. II.8.1). In<br />
the collision zone, huge clouds of dust are stirred up. In<br />
many places the collision caused the clouds to condense<br />
and to <strong>for</strong>m new stars. In this kind of galaxy interaction,<br />
the star <strong>for</strong>mation rate can increase from a few solar<br />
masses per year to 30 to 50 solar masses per year; <strong>for</strong> a<br />
short time the rate can be even higher.<br />
Fig. II.8.1: The Antennae in an overall view (left) and imaged<br />
with the hubble Space Telescope in detail (right). (Photo: B.<br />
Whitmore, naSa/eSa).


