

Max Planck Institute for Astronomy - Annual Report 2005
Max Planck Institute for Astronomy - Annual Report 2005
Max Planck Institute for Astronomy - Annual Report 2005

Create successful ePaper yourself
Turn your PDF publications into a flip-book with our unique Google optimized e-Paper software.
SFR [M � /a]<br />
80<br />
60<br />
40<br />
20<br />
0<br />
0 0.5 1 1.5<br />
Time [Gyr]<br />
In these starburst galaxies, the most massive and luminous<br />
stars dominate the radiation in the UV and blue<br />
spectral range. But at the same time, dust clouds absorb<br />
a large fraction of the light. There<strong>for</strong>e the regions of the<br />
most intense star <strong>for</strong>mation may not be visible at all in<br />
the UV or optical. But these young stars heat the dust,<br />
which then glows in the infrared. These galaxies then<br />
appear as ultra luminous infrared galaxies (ulirg) with<br />
total luminosities of more than 10 12 solar luminosities.<br />
The peak of the dust emission is at around 100 microns,<br />
which in distant galaxies is shifted towards longer wavelengths,<br />
so that these galaxies glow brightly in the submillimeter<br />
and millimeter wavelength range.<br />
Observationally, high star <strong>for</strong>mation rates are always<br />
linked to the presence of dense dust clouds. In numerous<br />
simulations, theorists have tried to account <strong>for</strong> this effect<br />
in order to be able to interpret the observations or to<br />
support simulations of galaxy evolution. However, previous<br />
attempts either neglected the presence of dust or<br />
else assumed very simplified geometries <strong>for</strong> the galaxies,<br />
which clearly could not apply to the complex merging<br />
systems.<br />
This new work uses a full radiative transfer model<br />
within detailed hydrodynamic simulations, so that <strong>for</strong> the<br />
first time astronomers can study the detailed appearance<br />
of merging galaxies at many wavelengths, including the<br />
effect of dust scattering, absorption, and re-emission.<br />
Another improvement in these simulations is a better<br />
treatment of the feedback of energy into the gas from<br />
supernovae with respect to previous work. The simula-<br />
II.8 Dynamics, Dust, and Young Stars – Computer Simulations of Merging Galaxies 47<br />
2 2.5 3<br />
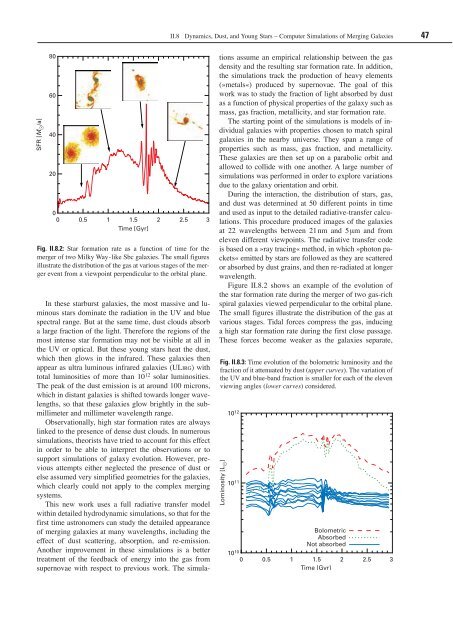
Fig. II.8.2: Star <strong>for</strong>mation rate as a function of time <strong>for</strong> the<br />
merger of two Milky Way-like Sbc galaxies. The small figures<br />
illustrate the distribution of the gas at various stages of the merger<br />
event from a viewpoint perpendicular to the orbital plane.<br />
tions assume an empirical relationship between the gas<br />
density and the resulting star <strong>for</strong>mation rate. In addition,<br />
the simulations track the production of heavy elements<br />
(»metals«) produced by supernovae. The goal of this<br />
work was to study the fraction of light absorbed by dust<br />
as a function of physical properties of the galaxy such as<br />
mass, gas fraction, metallicity, and star <strong>for</strong>mation rate.<br />
The starting point of the simulations is models of individual<br />
galaxies with properties chosen to match spiral<br />
galaxies in the nearby universe. They span a range of<br />
properties such as mass, gas fraction, and metallicity.<br />
These galaxies are then set up on a parabolic orbit and<br />
allowed to collide with one another. A large number of<br />
simulations was per<strong>for</strong>med in order to explore variations<br />
due to the galaxy orientation and orbit.<br />
During the interaction, the distribution of stars, gas,<br />
and dust was determined at 50 different points in time<br />
and used as input to the detailed radiative-transfer calculations.<br />
This procedure produced images of the galaxies<br />
at 22 wavelengths between 21nm and 5 mm and from<br />
eleven different viewpoints. The radiative transfer code<br />
is based on a »ray tracing« method, in which »photon packets«<br />
emitted by stars are followed as they are scattered<br />
or absorbed by dust grains, and then re-radiated at longer<br />
wavelength.<br />
Figure II.8.2 shows an example of the evolution of<br />
the star <strong>for</strong>mation rate during the merger of two gas-rich<br />
spiral galaxies viewed perpendicular to the orbital plane.<br />
The small figures illustrate the distribution of the gas at<br />
various stages. Tidal <strong>for</strong>ces compress the gas, inducing<br />
a high star <strong>for</strong>mation rate during the first close passage.<br />
These <strong>for</strong>ces become weaker as the galaxies separate,<br />
Fig. II.8.3: Time evolution of the bolometric luminosity and the<br />
fraction of it attenuated by dust (upper curves). The variation of<br />
the UV and blue-band fraction is smaller <strong>for</strong> each of the eleven<br />
viewing angles (lower curves) considered.<br />
Lominosity [L � ]<br />
10 12<br />
10 11<br />
Bolometric<br />
Absorbed<br />
Not absorbed<br />
10 10<br />
0 0.5 1 1.5<br />
Time [Gyr]<br />
2 2.5 3


