

Max Planck Institute for Astronomy - Annual Report 2005
Max Planck Institute for Astronomy - Annual Report 2005
Max Planck Institute for Astronomy - Annual Report 2005

You also want an ePaper? Increase the reach of your titles
YUMPU automatically turns print PDFs into web optimized ePapers that Google loves.
84 III. Scientific Work<br />
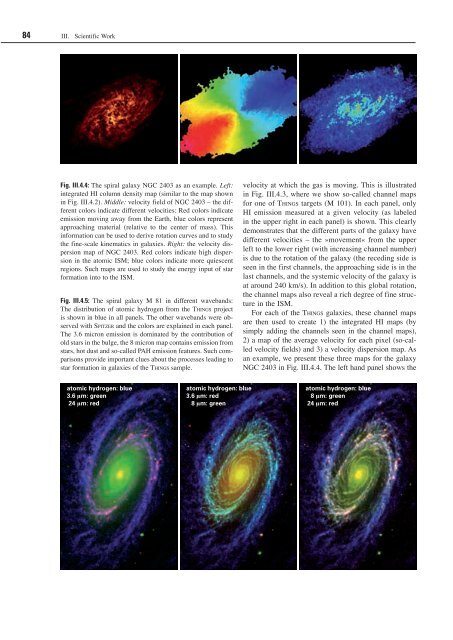
Fig. III.4.4: The spiral galaxy NGC 2403 as an example. Left:<br />
integrated HI column density map (similar to the map shown<br />
in Fig. III.4.2). Middle: velocity field of NGC 2403 – the different<br />
colors indicate different velocities: Red colors indicate<br />
emission moving away from the Earth, blue colors represent<br />
approaching material (relative to the center of mass). This<br />
in<strong>for</strong>mation can be used to derive rotation curves and to study<br />
the fine-scale kinematics in galaxies. Right: the velocity dispersion<br />
map of NGC 2403. Red colors indicate high dispersion<br />
in the atomic ISM; blue colors indicate more quiescent<br />
regions. Such maps are used to study the energy input of star<br />
<strong>for</strong>mation into to the ISM.<br />
Fig. III.4.5: The spiral galaxy M 81 in different wavebands:<br />
The distribution of atomic hydrogen from the Things project<br />
is shown in blue in all panels. The other wavebands were observed<br />
with spiTzer and the colors are explained in each panel.<br />
The 3.6 micron emission is dominated by the contribution of<br />
old stars in the bulge, the 8 micron map contains emission from<br />
stars, hot dust and so-called PAH emission features. Such comparisons<br />
provide important clues about the processes leading to<br />
star <strong>for</strong>mation in galaxies of the Things sample.<br />
atomic hydrogen: blue<br />
3.6 �m: green<br />
24 �m: red<br />
atomic hydrogen: blue<br />
3.6 �m: red<br />
8 �m: green<br />
velocity at which the gas is moving. This is illustrated<br />
in Fig. III.4.3, where we show so-called channel maps<br />
<strong>for</strong> one of Things targets (M 101). In each panel, only<br />
HI emission measured at a given velocity (as labeled<br />
in the upper right in each panel) is shown. This clearly<br />
demonstrates that the different parts of the galaxy have<br />
different velocities – the »movement« from the upper<br />
left to the lower right (with increasing channel number)<br />
is due to the rotation of the galaxy (the receding side is<br />
seen in the first channels, the approaching side is in the<br />
last channels, and the systemic velocity of the galaxy is<br />
at around 240 km/s). In addition to this global rotation,<br />
the channel maps also reveal a rich degree of fine structure<br />
in the ISM.<br />
For each of the Things galaxies, these channel maps<br />
are then used to create 1) the integrated HI maps (by<br />
simply adding the channels seen in the channel maps),<br />
2) a map of the average velocity <strong>for</strong> each pixel (so-called<br />
velocity fields) and 3) a velocity dispersion map. As<br />
an example, we present these three maps <strong>for</strong> the galaxy<br />
NGC 2403 in Fig. III.4.4. The left hand panel shows the<br />
atomic hydrogen: blue<br />
8 �m: green<br />
24 �m: red


