

Max Planck Institute for Astronomy - Annual Report 2005
Max Planck Institute for Astronomy - Annual Report 2005
Max Planck Institute for Astronomy - Annual Report 2005

Create successful ePaper yourself
Turn your PDF publications into a flip-book with our unique Google optimized e-Paper software.
40 II. Highlights<br />
log<br />
M� /pc2 �e 6<br />
5<br />
4<br />
3<br />
2<br />
4 6 8<br />
log M/M �<br />
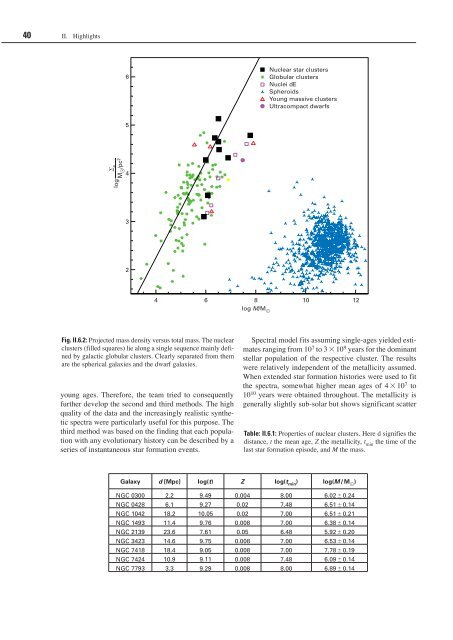
Fig. II.6.2: Projected mass density versus total mass. The nuclear<br />
clusters (filled squares) lie along a single sequence mainly defined<br />
by galactic globular clusters. Clearly separated from them<br />
are the spherical galaxies and the dwarf galaxies.<br />
young ages. There<strong>for</strong>e, the team tried to consequently<br />
further develop the second and third methods. The high<br />
quality of the data and the increasingly realistic synthetic<br />
spectra were particularly useful <strong>for</strong> this purpose. The<br />
third method was based on the finding that each population<br />
with any evolutionary history can be described by a<br />
series of instantaneous star <strong>for</strong>mation events.<br />
Nuclear star clusters<br />
Globular clusters<br />
Nuclei dE<br />
Spheroids<br />
Young massive clusters<br />
Ultracompact dwarfs<br />
10 12<br />
Spectral model fits assuming single-ages yielded estimates<br />
ranging from 10 7 to 3 � 10 9 years <strong>for</strong> the dominant<br />
stellar population of the respective cluster. The results<br />
were relatively independent of the metallicity assumed.<br />
When extended star <strong>for</strong>mation histories were used to fit<br />
the spectra, somewhat higher mean ages of 4 � 10 7 to<br />
10 10 years were obtained throughout. The metallicity is<br />
generally slightly sub-solar but shows significant scatter<br />
Table: II.6.1: Properties of nuclear clusters. Here d signifies the<br />
distance, t the mean age, Z the metallicity, t min the time of the<br />
last star <strong>for</strong>mation episode, and M the mass.<br />
Galaxy d [Mpc] log(t) Z log(t min ) log(M / M � )<br />
NGC 0300 2.2 9.49 0.004 8.00 6.02 � 0.24<br />
NGC 0428 6.1 9.27 0.02 7.48 6.51 � 0.14<br />
NGC 1042 18.2 10.05 0.02 7.00 6.51 � 0.21<br />
NGC 1493 11.4 9.76 0.008 7.00 6.38 � 0.14<br />
NGC 2139 23.6 7.61 0.05 6.48 5.92 � 0.20<br />
NGC 3423 14.6 9.75 0.008 7.00 6.53 � 0.14<br />
NGC 7418 18.4 9.05 0.008 7.00 7.78 � 0.19<br />
NGC 7424 10.9 9.11 0.008 7.48 6.09 � 0.14<br />
NGC 7793 3.3 9.29 0.008 8.00 6.89 � 0.14


