

Max Planck Institute for Astronomy - Annual Report 2005
Max Planck Institute for Astronomy - Annual Report 2005
Max Planck Institute for Astronomy - Annual Report 2005

Create successful ePaper yourself
Turn your PDF publications into a flip-book with our unique Google optimized e-Paper software.
48 II. Highlights<br />
and we see a temporary decline in the star <strong>for</strong>mation rate.<br />
But the galaxies then turn around, and during the final<br />
coalescence a powerful burst of star <strong>for</strong>mation occurs.<br />
After the final merger, the star <strong>for</strong>mation gradually tails<br />
off as the gas is consumed.<br />
These simulations predict that the total period of enhanced<br />
star <strong>for</strong>mation lasts <strong>for</strong> about two billion years.<br />
During this time the bolometric luminosity increases by<br />
almost one order of magnitude. However, the surprising<br />
result shown by this work is that the observed UV and<br />
blue-band luminosity stays almost constant because the<br />
dust density also increases, leading to increased attenuation<br />
of the light emitted by the young stars (Fig. II.8.3).<br />
This radiation escapes preferentially when the galaxy is<br />
viewed perpendicular to the disk plane so that the galaxy<br />
appears up to twice as bright when viewed face-on rather<br />
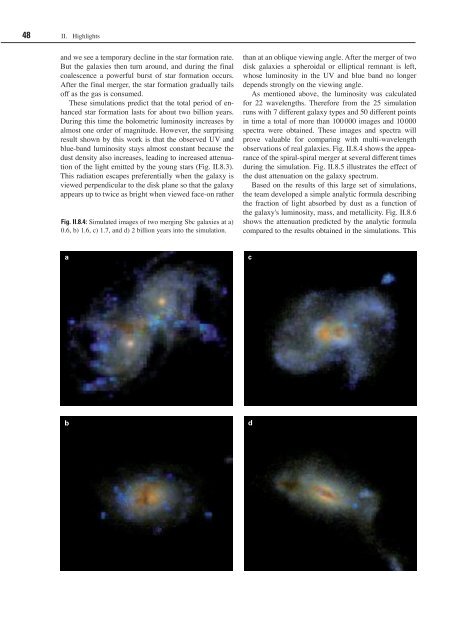
Fig. II.8.4: Simulated images of two merging Sbc galaxies at a)<br />
0.6, b) 1.6, c) 1.7, and d) 2 billion years into the simulation.<br />
a<br />
b<br />
than at an oblique viewing angle. After the merger of two<br />
disk galaxies a spheroidal or elliptical remnant is left,<br />
whose luminosity in the UV and blue band no longer<br />
depends strongly on the viewing angle.<br />
As mentioned above, the luminosity was calculated<br />
<strong>for</strong> 22 wavelengths. There<strong>for</strong>e from the 25 simulation<br />
runs with 7 different galaxy types and 50 different points<br />
in time a total of more than 100 000 images and 10 000<br />
spectra were obtained. These images and spectra will<br />
prove valuable <strong>for</strong> comparing with multi-wavelength<br />
observations of real galaxies. Fig. II.8.4 shows the appearance<br />
of the spiral-spiral merger at several different times<br />
during the simulation. Fig. II.8.5 illustrates the effect of<br />
the dust attenuation on the galaxy spectrum.<br />
Based on the results of this large set of simulations,<br />
the team developed a simple analytic <strong>for</strong>mula describing<br />
the fraction of light absorbed by dust as a function of<br />
the galaxy's luminosity, mass, and metallicity. Fig. II.8.6<br />
shows the attenuation predicted by the analytic <strong>for</strong>mula<br />
compared to the results obtained in the simulations. This<br />
c<br />
d


